Speed = 4.10 / 230 = 0.017826m/s
This result tells us that material is transported along the coast in the direction of the main wind, in this case from West to East at a speed of 0.018 metres per second.
While we were at this site we looked at the sea defences and groynes. The groynes here were made of concrete. On the East side of the groyne the beach material was 90cm below the top of the groyne. The material on this side consisted of smaller particles of rock and some sand. On the West side of the groyne, the beach material was 72cm below the top of the groyne.
As well as groynes this beach had other sea defences. There was a sea wall on top of a bank above the beach there was a promenade made of concrete and a revetment style of sea defence along the base of the cliffs.
Location - Site 2: Rottingdean
Aim - To investigate the beach characteristics and costal defences
After completing the fieldwork at St Dunstan’s Steps we then walked down the beach until we got to site 2 – Rottingdean.
At this site we were to complete the same tasks as at St Dunstan’s Steps.
We did the ‘Particle Size and Type Analysis’ again using the same equipment and recording the same data.
The results for this task were…
All the pebbles at this site came up as rounded on our pebble shape chart. This is because they have been transported from elsewhere and so have been eroded and affected by attrition. The results tell us that the majority of the beach material gets deposited orientated towards the West. This shows us that the material is more likely to have travelled to the beach from an Easterly direction. The smallest pebbles here were also at the top of the beach. I think this is because of the same reason as before - they have been submitted to the most erosion because when the tide was higher they would be worn away against the cliff, or sea wall. It could also be because they were brought to the top of the beach during a time when the waves were more powerful. During that time the pebbles would be being submitted to greater erosion by attrition, because the energy of the waves would cause the effect of attrition to happen faster.
We performed the ‘Longshore Drift Analysis’ task at this site. We dropped the dog biscuit in the water. There were lots of seagulls in the water so every now and then we lost site of the dog biscuit. After a few minutes we could no longer find the dog biscuit. We came to the conclusion that one of the seagulls must have eaten it, as the dog biscuit was nowhere to be seen.
We had to use another group’s results for this experiment and the results were…
Speed = 0.025m/s
This is an approximate average of 3 metres every 2 minutes.
While we were doing this task we noticed something else. Where the groynes stuck out into the water they were causing a small amount of wave refraction, some of the waves were bending in towards the groyne as they neared the beach.
We also looked at the costal defences and groynes at this site. The groynes at Rottingdean were made up of enormous rocks and boulders, known as riprap. To the east side of the groynes the beach material was over 2m below the top of the groyne. On the west side of the groyne however, the beach material was almost level with the top of the groyne. This shows how effective the groynes are at stopping longshore drift and keeping the beach from being eroded away. The beach material on both sides of the groynes was made up of pebbles and there was no fine sand. Other costal defences were a sea wall and a revetment along the base of the cliff.
Human Fieldwork
Location - Brighton
Aim - To analyse tourist provision for visitors to Brighton
At Brighton one of our tasks was to carry out a questionnaire, asking ten people about what they though of the shops and services at Brighton.
We then had to choose two questions and represent the data in a suitable graphical technique. To get a better response from these questions our class combined answers to the questionnaire. So instead of a total of 10 people we had a total of 48 people. Out of the questionnaire the two questions I chose were:
‘What is the purpose of your visit today?’
‘Who do you think the seafront facilities are aimed at more?’
These were the results…
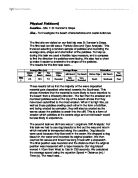
What is the purpose of your visit today?
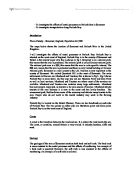
Who do you think the seafront facilities are aimed at more?
The first chart for the question ‘What is the purpose of your visit today?’ tells us that the majority of people interviewed in Brighton visit this town for the purpose of Sightseeing.
The second graph for the question ‘Who do you think the seafront facilities are aimed at more?’ clearly shows that most people who were interviewed thought the facilities at Brighton were aimed at ‘Day-trippers’.
The second of our tasks was to complete a land use map along the sea front at Brighton. For this task we had to walk around Brighton and note down the types of services we saw. The areas we had to record facilities for were the Boardwalk, the Promenade and any other services along the sea front.
From our map we learnt that the most common services to be found along the sea front of Brighton were entertainment and food facilities. Some of the food facilities were fast food, for example – Fish ‘n’ Chips, and Burger Bars. There was also a wide range of food outlets ranging from Chinese to Italian.
We also found out that the majority of shops here were souvenir shops and mainly aimed at tourists, though there was also several clothing and accessory shops.
From our land use map another service that we found was quite common, once you went inland past the promenade, was Hotels and other places to stay.
From this evidence I would conclude that the town of Brighton is a town mainly aimed at tourists and other holidaymakers, rather than at the locals of the area.
By Joanna Booth 10LM