Numerical Method (Maths Investigation)
NUMERICAL METHOD
INTRODUCTION
It is very useful to use Numerical Method to find the roots of an equation that cannot be solved ALGEBRAICALLY. Quadratic equations in the format of can be solved by Quadratic Formula: . However, for polynomial equations, that have highest power more than 2, has to be solved through Trial and Error, which is very hard and tedious to determine their roots. Moreover, some roots of polynomial equations may be not Integer or Large numbers, which make things harder.
Therefore NUMERICAL METHOD is developed to help to solve polynomial equations. In P2, we learned that there are two types of Numerical Method:
* Change of Sign Method
o Decimal Search
o Interval Bisection
o Linear Interpolation
* Fixed Point Iteration
o Newton-Raphson Method
o Rearrangement Method
About Coursework
Things have to do for Coursework:
* One kind of Change of Sign Method;
* Newton-Raphson Method;
* Rearrangement Method;
* Failures of each methods;
* Error Bound of each methods;
* Comparison made with the three methods above; and
* Ease of use and Availability of Hardware and Software to do coursework.
CONTENTS:
PAGE No.
Description
2
Change of Sign Method and its Failure
8
Newton-Raphson Method and its Failure
2
Rearrangement Method and its Failure
7
Comparison made onto one roots of an equation with the 3 Methods above
22
Ease of use and Availability of Hardware and Software used, e.g.:
* T1 Calculator
* Graphmatica or Autograph
* Microsoft Excel
* Microsoft Word
24
Appendix A
CHANGE OF SIGN METHOD
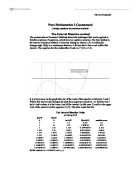
I choose to use Decimal Search, as it is the easiest of all methods through the use of Microsoft Excel. It is to find the roots of an equation that crosses the x-axis. The positive value and negative values of the y-value has to be observed.
EQUATION USED: = 0 has only 1 roots in [0,-1]
From Graphmatica:
Results obtained from Microsoft Excel:
X-value
F(X)
-1
-1.5
0
0.5
Observe the change of y-value from negative value to positive value in the table. That shows that the root of the equation where the y-value is 0, is between x = 0 and x = -1. Now this is step 1, we're moving on to step 2.
X-value
F(X)
-0.9
-0.7882969
-0.8
-0.3497152
-0.7
-0.0723543
-0.6
0.1120064
Now the search is narrowing in and it comes to one decimal place in between x = -1 and x = 0. Look up for the change of sign here and it is between x = -0.6 and x = -0.7. Hence, the roots is now between x = -0.6 and x = -0.7.
Now I move on to step 3, step 4 and so on until the fifth decimal place. The more decimal place the more accurate the answer of the root is.
X
Y
-0.69
-0.050563533
-0.68
-0.029629888
-0.67
-0.009507116
-0.66
0.009848393
-0.65
0.028477721
-0.64
0.046419535
-0.63
0.063710194
-0.62
0.080383854
-0.61
0.096472572
Tbl DS-03: Step 3
X
Y
-0.669
-0.007537736
-0.668
-0.005575983
-0.667
-0.003621818
-0.666
-0.001675197
-0.665
0.000263921
-0.664
0.002195576
-0.663
0.004119811
-0.662
0.006036665
-0.661
0.007946179
Tbl DS-04: Step 4
X
Y
-0.6659
-0.001480948
-0.6658
-0.001286774
-0.6657
-0.001092676
-0.6656
-0.000898652
-0.6655
-0.000704703
-0.6654
-0.000510829
-0.6653
-0.000317029
-0.6652
-0.000123304
-0.6651
7.03455E-05
Tbl DS-05: Step 5
X
Y
-0.66519
-0.000103936
-0.66518
-8.45685E-05
-0.66517
-6.52016E-05
-0.66516
-4.58355E-05
-0.66515
-2.64701E-05
-0.66514
-7.1055E-06
-0.66513
.22584E-05
-0.66512
3.16215E-05
-0.66511
5.09839E-05
Tbl DS-06: Step 6
I have stopped at Step 6, as it will get more and more numbers behind the decimal point if I continue on. However, I haven't got to an answer that I satisfy. I only got its range, -0.66514 < root of the equation used < -0.66513. So, I decide to get their error bound by:
Average of the upper and lower error bound =
=
Upper Error Bound =
Lower Error Bound =
The Error Bound of the root of this equation is
Approximate Root Value is
FAILURE OF CHANGE OF SIGN METHOD
However, this Change of Sign Method comes to a failure when solving a graph that has an equal root, i.e. having the x-axis as its tangent to the curve. For example the equation=0.
When x = 2
When x = 2.6
By referring to the table below, this proves that Microsoft Excel is correct.
A Set of values from Microsoft Excel:
X
F(x)
0
-1.6641
0.1
-1.4161
0.2
-1.1881
0.3
-0.9801
0.4
-0.7921
0.5
-0.6241
0.6
-0.4761
0.7
-0.3481
0.8
-0.2401
0.9
-0.1521
x
f(x)
-0.0841
.1
-0.0361
.2
-0.0081
.3
-1E-04
.4
-0.0121
.5
-0.0441
.6
-0.0961
.7
-0.1681
.8
-0.2601
.9
-0.3721
X
f(x)
2
-0.5041
2.1
-0.6561
2.2
-0.8281
2.3
-1.0201
2.4
-1.2321
2.5
-1.4641
2.6
-1.7161
2.7
-1.9881
2.8
-2.2801
2.9
-2.5921
3
-2.9241
NEWTON-RAPHSON METHOD
One of the Fixed Point Iteration and it has something to do with drawing and finding the equation of the tangent to the curve at points on the curve. A diagram is shown below to illustrate Newton-Raphson Method and the derivation of which I will use in the example.
The gradient of the tangent at (x1,f(x1)) is . Since the equation of a straight line can be written as
The equation of the tangent to the curve at (x1,y1) is
Since the tangent cuts the x-axis at x = x2,
By substituting X1 with Xn and X2 with Xn+1, we have derived the formula:
The root can be found by keep on using this Xn+1 formula, until a small difference between the last Xn and the new Xn can be observed, maybe only the sixth decimal place onward (going onto seventh decimal place, eighth decimal place and so on) is changing, we can take the first five decimal place from the new or old Xn, then calculate the error bound of the root and write down the approximate root value. For this method, I have to find all the roots of this equation I choose to use.
EQUATION USED: = 0, ,
Case 1: Finding the ROOT of the Equation at [0.5,1]
From Microsoft Excel: (Tbl NRM-01)
n
Xn
f(Xn)
f / (Xn)
Xn+1
0.5
0.148721271
-1.351278729
0.610059655
2
0.61005
0.010362228
-1.159458807
0.61899678
3
0.61899
7.37235E-05
-1.142935937
0.619061283
4
0.61906
3.86344E-09
-1.142816146
0.619061287
When x = 0.5,
From here, we can see that Microsoft Excel is correct.
So, we take the value, 0.61906.
Upper ...
This is a preview of the whole essay
EQUATION USED: = 0, ,
Case 1: Finding the ROOT of the Equation at [0.5,1]
From Microsoft Excel: (Tbl NRM-01)
n
Xn
f(Xn)
f / (Xn)
Xn+1
0.5
0.148721271
-1.351278729
0.610059655
2
0.61005
0.010362228
-1.159458807
0.61899678
3
0.61899
7.37235E-05
-1.142935937
0.619061283
4
0.61906
3.86344E-09
-1.142816146
0.619061287
When x = 0.5,
From here, we can see that Microsoft Excel is correct.
So, we take the value, 0.61906.
Upper Bound = 0.619065 Lower Bound = 0.619055
f(Upper bound) = -4.243 10-6 f(Lower Bound) = 7.185 10-6
Error Bound = 0.619065 - 0.61906 = 0.000005
Hence Approximate Root Value is 0.61906 0.000005
Case 2: Finding the ROOT of the equation at [1.5,2]
From Microsoft Excel: (Tbl NRM-02)
n
Xn
f(Xn)
f / (Xn)
Xn+1
.5
-0.01831093
.48168907
.512358146
2
.51235
0.000343644
.537418082
.512134625
3
.51213
.13339E-07
.53640399
.512134552
4
.51213
.24345E-14
.536403655
.512134552
So, we take the value from the table, 1.51213.
Upper Bound = 1.512135 Lower Bound = 1.512125
f(Upper Bound) = 6.88810-7 f(Lower Bound) = -1.47810-10
Error Bound = 1.512135 - 1.512125 = 0.000005
Hence, Approximation Value = 1.51213 0.000005
FAILURE OF NEWTON-RAPHSON METHOD
Newton-Raphson method can be counted as one of the best method to calculate approximation value, however, "When there's ADVANTAGE, there's DISADVANTAGE". The Newton-Raphson Method failed when it comes to a graph that will push the tangent to the curve away from the domain. There's a graph below to illustrate what I have point out.
The curve in the Gph NRM-04 has the equation = 0, and it has only one root at interval of [0,0.5]. A tangent to the curve at point (0.5, f(0.5)) is drawn and observes where it cut the x-axis. It cut at a point on the x-axis that is out of the domain of the equation and hence Newton-Raphson Method cannot be continue on and it come to a halt, i.e. FAIL to solve such equation.
n
Xn
f(Xn)
f / (x1)
Xn+1
0.5000000000
0.467106781
0.353553391
-0.82118
2
-0.82117749
#NUM!
#NUM!
#NUM!
3
#NUM!
#NUM!
#NUM!
#NUM!
REARRANGEMENT METHOD
Another method of Fixed Iteration Method. Any equation f(X) = 0 can be arranged in the form X = g(X) in any number of ways, depending the number of an unknown variable, e.g. X, in the f(X). For example, f(X) = 5X - 7X2 + 1 has two possibilities as it has 2 unknown variable, X. In the example later, I will make one bold and one regular capital to show each X's possibilities. After the f(X) equation has been rearrange to have one or more possibilities, draw the graph(s) of g(X) and the line y = x. The intersection between a graph of a g(X) function of f(X) and line y = x will be the root(s) of the f(X). Then use the basis or iteration, Xn+1 = g(Xn) to solve the equation. Before doing so, it is necessary to check the root in a certain interval is suitable to find using that particular possibility you have chosen using g/(Xn) and make sure that CONDITION:
EQUATION USED: 5X - 7X4 + 1 = 0
Let f(x) = 5X - 7X4 + 1 = 0
The EQUATION has two possibilities: CASE
. Making X the subject:
7X4 = 5X + 1
X4 =
X = , g(X) =
2. Making X the subject:
5X = 7X4 - 1
X = , g(X) =
Now the 2 possibilities of f(X) are written down on the top of this and then from Gph RM-01, we take note of the roots of the equation f(X). It has 2 roots but this coursework requires us to do one of the roots only. Hence, I choose the root that is in the range of [0.5,1].
Now, I want to check for the suitability of implying the root (in range of [0.5,1]) into g/(Xn) and make sure it match the CONDITION. *CASE = Possibilities
For CASE 1: (X) =
For CASE 2: (X) =
The Interval of [0.5,1] is 0.75, therefore, LET X be 0.75, hence
g/(0.75) = 0.23884{-1< g'(X) < 1}, it is suitable for using this CASE 1 to find this root.
g/(0.75) = 2.3625 { >1}, it is NOT suitable for using CASE 2 to find this root. [Show at next section - How Basis Iteration Fail to find Required Root]
Below is a graph of a curve, g/(X) and a line, y = x intersecting at each other at a point. That INTERSECTION POINT IS THE ROOT OF F(X).
However, there's two way of representing the BASIC ITERATION, Xn+1 = g(Xn). One is STAIRCASE DIAGRAM (Gph RM-03) and another one is COBWEB DIAGRAM (Gph RM-04).
EQUATION USED FOR STAIRCASE DIAGRAM:
and
EQUATION USED FOR COBWEB DIAGRAM:
and
STAIRCASE DIAGRAM:
COBWEB DIAGRAM:
When x = 0.5
Table importing from Microsoft Excel:
n
Xn
Xn+1
f(Xn)
0.50000
0.84090
.75000
2
0.84090
0.92858
0.25473
3
0.92858
0.94755
-0.39294
4
0.94755
0.95150
-0.54719
5
0.95150
0.95232
-0.58000
6
0.95232
0.95249
-0.58682
7
0.95249
0.95253
-0.58823
8
0.95253
0.95253
-0.58852
9
0.95253
0.95254
-0.58858
0
0.95254
0.95254
-0.58860
1
0.95254
0.95254
-0.58860
Tbl RM-01: Using Case 1:to find the required root at [0.5,1]
The Method of calculating error bound for the approximation root value.
We take the value, 0.95254 from this table as f(Xn) proceeds to zero.
Upper Bound = 0.952545 Lower Bound = 0.952535
f(Upper Bound) = -0.0001612 f(Lower Bound) = 3.07510-5
Error Bound = 0.952545 - 0.95254 = 0.000005
Hence, Approximate Root Value = 0.95254 0.000005
HOW BASIS ITERATION FAIL TO CONVERGE TO THE REQUIRED ROOT
To show the failure of the Basis Iteration, Xn+1 = g(Xn), I apply CASE 2 on the required root, which is the one in between [0.5,1]. It is proved unsuitable by substituting x = 0.75 into g/(x) of CASE 2 and the value does not match the CONDITION. Now I want to prove why the condition fails in this CASE.
Here is a graph of and , where g(X) is the same thing as y.
From Microsoft Excel:
n
x1
x2
f(x1)
0.5
-0.1125
.75
2
-0.1125
-0.199775747
0.34890625
3
-0.199775747
-0.19777003
-0.278251179
4
-0.19777003
-0.197858244
-0.262641041
5
-0.197858244
-0.19785442
-0.263326415
Tbl RM-02: Use Case 2: to find the required root at [0.5,1]
From the table, we can see the last two value will not give us a satisfy answer. Hence we can see that because it does not match the condition, hence it cannot be find with that g(X) equation as it leads to the failure of basis iteration.
FAILURE OF REARRANGEMENT METHOD
The failure of basis iteration to find the required root is also considered as the failure of the rearrangement method. Now, let me show it graphically here.
One can see here that the COBWEB diagram has fail to show here as after it reach the graph, and when it bends, there is no way to reach the y = x line. Since for COBWEB diagram to be successfully drawn, the gradient of the tangent to the curve at certain point must be more than -1, hence if it fails, this shows that the gradient of the tangent of the curve at this point is less than -1.
For the staircase diagram shown on the graph, it leads to find the other non-required roots. Since for STAIRCASE Diagram to be successfully drawn, the gradient of the tangent to the curve at certain point must be less than 1, hence if it fails, this shows that the gradient of tangent to the curve at this point is more than 1. Hence it can't find the required roots here using both methods.
COMPARISON MADE WITH ALL THREE METHODS
After doing all three methods, i.e. Change of Sign Method, Newton-Raphson Method and Rearrangement Method, with each different examples showing how it works. It is logical to use one of the equations above that are most suitable for applying the other two methods to find the required root. Most Suitable equation is the equation that doesn't meet to the criteria of the failure of all these three methods.
From the three equations above use for each methods, I choose the one used for Newton-Raphson Method.
EQUATION USED:, the required root is at [1.5,2]
DECIMAL SEARCH
A Table has been imported from Microsoft Excel producing the result of the changing of sign method.
X
F(X)
.5
-0.01831093
2
.389056099
This is the 1st step of the decimal search. Then come a few more steps in another table.
X
F(X)
.51
-0.003269206
.52
0.012225195
.53
0.028176822
.54
0.044590271
.55
0.061470183
.56
0.078821245
.57
0.096648194
.58
0.114955811
.59
0.133748928
x
F(X)
.511
-0.001740211
.512
-0.000206685
.513
0.001331377
.514
0.00287398
.515
0.004421127
.516
0.005972823
.517
0.007529074
.518
0.009089883
.519
0.010655255
X
F(x)
.5121
-5.30826E-05
.5122
0.000100565
.5123
0.000254258
.5124
0.000407996
.5125
0.000561779
.5126
0.000715608
.5127
0.000869482
.5128
0.001023402
.5129
0.001177367
x
F(x)
.51211
-3.77199E-05
.51212
-2.23567E-05
.51213
-6.99314E-06
.51214
8.37092E-06
.51215
2.37354E-05
.51216
3.91004E-05
.51217
5.44658E-05
.51218
6.98317E-05
.51219
8.5198E-05
Average of Upper and Lower Limit =
Error Bound = 0.000005
Hence, the approximation root value is 1.512135 0.000005, which is equal to the example shown above in Newton-Raphson section.
NEWTON-RAPHSON METHOD
***Shown in NEWTON-RAPHSON METHOD SECTION, Page 5
REARRANGEMENT METHOD
The two possibilities of the equation are:
CASE 1:
CASE 2:
Test each case whether rearrangement method can be apply here by substituting each x in CASE 1 and X in case 2 with the interval of [ 1.5,2] which is 1.75.
Using a calculator,
When x = 1.75, CASE 1 g/(X) = 1.9182 (> 1), therefore I can't use this case as it will lead me to the failure of basis iteration.
When X = 1.75, CASE 2 g/(x) = 0.5714 (<1 and >-1). Since it match the condition and the rearrangement method can be used here.
From Microsoft Excel:
Iteration
Xn
Xn+1
Difference between Xn and Xn+1
.50000
.50408
0.004077397
2
.50408
.50679
0.002714577
3
.50679
.50860
0.001803185
4
.50860
.50979
0.001195989
5
.50979
.51058
0.000792469
6
.51058
.51111
0.000524749
7
.51111
.51146
0.000347321
8
.51146
.51169
0.000229819
9
.51169
.51184
0.00015204
0
.51184
.51194
0.000100571
1
.51194
.51200
6.65204E-05
2
.51200
.51205
4.39958E-05
3
.51205
.51208
2.90972E-05
4
.51208
.51210
.92434E-05
5
.51210
.51211
.27264E-05
6
.51211
.51212
8.41634E-06
7
.51212
.51212
5.56594E-06
8
.51212
.51213
3.68089E-06
9
.51213
.51213
2.43425E-06
20
.51213
.51213
.60981E-06
See that the difference of Xn+1 and Xn is decreasing until it is almost insignificant. Hence I took the fifth decimal place which you can see here is 1.51213.
Tbl CPS-03: The Table of using rearrangement method to solve the f(x) = ex-3x by using the basis iteration Xn+1= ln (3 Xn).
Using Calculator,
Upper Bound = 1.512135 Lower Bound = 1.512125
f(upper bound) = 6.889 10-7 f(lower bound) = -1.476 10-5
Therefore, error bound is 1.512135 - 1.51213 = 0.000005
Therefore the Approximation root value id 1.51213 0.000005
When Xn = 1.5
COMPARATIVE SPEED OF THESE THREE METHODS
After using all three methods to find the approximate root value of at [1.5,2] and all three produce the same result (1.51213 0.000005). However, the speed of using these methods is very important here.
One of the factor that affect the speed of applying each different methods is THE USE OF COMPUTER. The Computer has many useful programs that help me to finish my coursework, such as Microsoft Excel, Microsoft Word and a kind of software that help to sketch the graph of any equation I type in, i.e. Graphmatica and Autograph.
With the aid of these computer software, I think that "Decimal Search" can be the fastest way although many steps are required, but a function of Microsoft Excel allows us to apply the Decimal Search and the required root can be found quickly. Actually, for Decimal Search, I can stop when I observed that there is a change of sign. However, I continue and always get a set of nine values and bold the two where there is a change of sign, so that it will be more presentable and easily align to my Coursework. The Newton-Raphson method and Rearrangement Method can also be done with the aid of computer quickly but it needs formulas to be able to calculate the Xn+1 in the process of getting the required root.
Without the aid of these computer software, it will be much a harder work. In this case, Decimal Search can be the slowest of all, as I have to observe the change of sign by substituting the approximate value into the equation and find the required root slowly and carefully, making sure that no errors is made or I will get the wrong answer. Using a calculator, for example, I might press in 1.51218 instead of 1.51213 and this will give me the wrong answer. I think that Rearrangement Method should be the fastest of all three without the aid of computer software because we just need to find the possibilities, their differentiation and substituting the middle value in the interval of [X1,X2], at which the root is between [X1,X2]. By observe which one will not lead to the failure of basis iteration that will not find the required root, use that possibilities with basis iteration (Xn+1 = g(Xn)) to find the approximation root value.
Although Newton-Raphson method may need less steps to reach the approximation root value, it has to find more items in order to get the approximation root value. Items, like drawing tangent and find the equation of the tangent. However, with or without the use of computer, Newton-Raphson Method seems to be the best method among the three method I have been used to compare here. It has an iteration formula: . I can find the gradient of the tangent to the curve at certain point by differentiate the equation of the curve and substitute the Xn into it. I can create a table with columns of Xn, f(Xn), f / (Xn) and Xn+1 then I can find the approximation root quite easily, of course, I will also need to do it carefully, so do I need for Rearrangement Method.
Here is a table that compare the steps by each method on this f(x) = ex - 3x.
f(x) = ex - 3x
Decimal Search
Newton-Raphson Method
Rearrangement Method
Number of Iterations
5
4
20
Tables Used
5
EASE OF USE OF COMPUTER HARDWARE AND SOFTWARE
My Coursework can't be done without the use of computer hardware and software listed below:
* TI Calculator
* Graphmatica or Autograph
* Microsoft Excel XP
* Microsoft Word XP
I use TI Calculator to prepare the equation I need to use in the Coursework. I also allow me to get an approximate root value by tracing a cross along the graph that will show me the approximate coordinate of the graph of equation I think of. It also allows me to zoom in or set the scale and range that I want to. It can also act as an calculator that will also can store memory, like Xn and Xn+1 which in each fixed iteration method, I need them to repeat the values themselves.
However, TI calculator can't be presented onto the computer. I can get the sketch of the graph of the equation I have drawn, but I can copy them onto my Coursework, which is done using computer software. Since the TI calculator screen is monochrome in colour, if I have two graphs on the screen, I can differentiate the two graphs, which one is which since it doesn't write there beside the graph too in the screen. Hence I only use it in the beginning of the Coursework when I thinking of the equations that I need to use for the examples of the three method.
Often, I use Graphmatica instead of Autograph as Autograph seems new to me as I have never use it before. I have use Graphmatica in my secondary years before I come to Year 12 as my teachers have ask me to do the sketching of graphs of any kind, and I use Graphmatica to give me an idea of the sketch of the graph. I think it is better than TI Calculator as Graphmatica differentiate graphs of equation I have type in by colours. I can know the equation of the graph by just clicking on the graph and the equation will automatically show in the INPUT BAR (where I input my equations one by one and ENTER after each one). Graphmatica also allows me to control the ranges and scales. It also provides functions of ZOOMING, varieties of graph paper and different type of presentation (Either by dots, grid lines or none). I can set the scales to Automatic and it will help me to adjust to my likings as I can always change them myself. Another advantage of Graphmatica is that the graph produced can be copy onto the Coursework I'm doing, which I have done. (See Diag NRM-01)
However, Graphmatica only allows me to draw one tangent which is not enough to show how Newton-Raphson Method work, which I may need at least two tangents, one at Xn and another one at Xn+1.
Microsoft Excel XP has contributed 35% of my Coursework. 50% is Microsoft Word XP and the remaining 15% is TI Calculator and Graphmatica. Microsoft Excel XP helps to create tables for recording the steps of the three methods. Without Microsoft Excel XP, Decimal Search will be a very hard work. Microsoft Excel XP allows me to name a range of cells, and allow it be x-value to be substitute into a prepared y-value. (See Appendix A for clearer explanation)
However, Microsoft Excel XP is not being able to plot such a clear graph like Graphmatica do. One person has to know how to use Microsoft Excel before he or she is able to use it. It is unlike Graphmatica which is quite user-friendly, as when user sees the INPUT BAR, he or she may try to input an equation, unlike Microsoft Excel, where there is a lot of functions the user doesn't know how to apply or use. Hence it is not very user-friendly for beginners.
Actually Microsoft Word XP has make out all my Coursework. I use it to create my Documentation of my Coursework. It allows me to design what I would like to be seen in my Coursework as it has the function of WHAT YOU SEE IS WHAT YOU GET (WYSIWYG). I can copy tables from Microsoft Excel and graphs from Graphmatica and organise them neatly in my Coursework. It also gives my variety of fonts and sizes that I may prefer to. Neat Alignment can help my Coursework to look neat and tidy. I can even get an eye of my coursework before I get it print out by PREVIEW it, making sure that I am satisfies with it. When there's a mistake somewhere in the page, and after I locate it, I just need to modify it at that place, and I will need not to do everything all over again. I have to if I'm writing my Coursework out with paper, pens and colour pencils. Drawings (i.e. Arrows, lines, shapes and even beautiful word art) can be done on Microsoft Word XP itself. I don't need to go to PAINT and copy the diagram I have drawn and paste it in my Coursework.
I think Microsoft Word is user-friendly software to use as it is like a typewriter where you type in your document. So everyone will know how to use it and that's the main advantage of Microsoft Word.
~ ~ ~ ~ ~ END OF MY COURSEWORK!!! ~ ~ ~ ~ ~
APPENDIX A
Here are the formulas from Microsoft Excel that I have used in my Coursework.
For DECIMAL SEARCH
X
F(X)
.51211
=EXP(X_)-3*X_
.51212
=EXP(X_)-3*X_
.51213
=EXP(X_)-3*X_
.51214
=EXP(X_)-3*X_
.51215
=EXP(X_)-3*X_
.51216
=EXP(X_)-3*X_
.51217
=EXP(X_)-3*X_
.51218
=EXP(X_)-3*X_
.51219
=EXP(X_)-3*X_
Tbl AppA-01: Formula used in Microsoft Excel XP for decimal search
From the table above, under the f(X)-value column, it all contains the formula =EXP(X_)-3*X_. I'm using and apply the Decimal Search. The EXP(X_) means e(X_), and X_ is what I have named the whole column of X-value, so that when it got to "X_", it will look for the X_ in the same row and substitute it in to complete the formula and result will appear. If the value at X-value column is not an integer or decimal that it can substitute to find the result, it will write "#REF", to show there's no reference of X_ to be substitute.
I just need to type in one row, e.g. X-column: 1.51211, F(X)-column: =EXP(X_)-3*X_ (I can't write 3X as it will appear no meaning in Microsoft Excel). Then result will come out in first row of F(X)-Column. Then I go to the second row and type in X-Column: 1.51212. To copy F(X)-column formula, I don't need to repeat typing the formula, I just need to go to first row of Column F(X) and direct the mouse to the lower-bottom corner of the selected cell. The arrow will change itself into a small black cross. Just click and drag it down. You can see in the picture below as shown:
In every cell that you have drag onto, they have the same formula as the first one. This is very useful as even if you didn't name the X-value cell as X_, you can use cell names, e.g. the 1.51211 is at cell A2. Just make the formula be "=EXP(A2)-3*(A2)". When it is being dragged (not copied or moved) onto another cell, the formula will change itself like "=EXP(A3)-3*(A3)". After you have write two records in X-column, select the two records, then just applying the same click and drag at the corner onto the cells below them. Observe that the values obtained have increase to 1.51213, 1.51214 and so on. The numbers is either step up automatically or step down with number of steps determined by the two selected records. If you type in 2 in first row and 4 in second row under the same column, by applying the clicking and drag method, you will see 6, 8, 10 and so on.
For NEWTON-RAPHSON METHOD
Table of Formulas that I have use imported from Microsoft Excel XP.
A B C D
Xn
f(Xn)
f'(Xn)
Xn+1
.5
= EXP(x1_) - 3*x1_
=EXP(x1_) - 3
=(x1_) - (y1_ / m)
=D15
= EXP(x1_) - 3*x1_
=EXP(x1_) - 3
=(x1_) - (y1_ / m)
=D16
= EXP(x1_) - 3*x1_
=EXP(x1_) - 3
=(x1_) - (y1_ / m)
=D17
= EXP(x1_) - 3*x1_
=EXP(x1_) - 3
=(x1_) - (y1_ / m)
This is more complicated than the Decimal Search as more formulas need to apply and names need to assign to. Since after the first time, X0, we assign our own value, but later, X1, X2, etc, we use the values we find in Xn+1, so I make the second row of Xn as "=D15" which is the first row of column Xn+1. I have to think of the differentiation of the f(Xn) my self and type in the formula under column f ' (Xn). In Xn+1, the m is the name I assigned for f '(Xn). I use the iteration formula to calculate my Xn+1.
For REARRANGEMENT METHOD
Table of formula below is what I used in my Coursework for examples and Comparison.
A B C D
Xn
Xn+1
***Difference between Xn and Xn+1
f(Xn)
.5
=LN(3*x1_)
=x2_-x1_
=EXP(x1_) - 3*x1_
=B43
=LN(3*x1_)
=x2_-x1_
=EXP(x1_) - 3*x1_
=B44
=LN(3*x1_)
=x2_-x1_
=EXP(x1_) - 3*x1_
=B45
=LN(3*x1_)
=x2_-x1_
=EXP(x1_) - 3*x1_
=B46
=LN(3*x1_)
=x2_-x1_
=EXP(x1_) - 3*x1_
=B47
=LN(3*x1_)
=x2_-x1_
=EXP(x1_) - 3*x1_
=B48
=LN(3*x1_)
=x2_-x1_
=EXP(x1_) - 3*x1_
Basis Iteration, Xn+1 = g(Xn) is what I use to find Xn+1. The g(X) of f(X) = ex-3x is ln (3x). Therefore you can see under Xn+1 column, "=LN(3*x1_)". Here, like Newton-Raphson Method, Xn always takes in Xn+1 value except the first one.
I add in two extra items, the difference between Xn and Xn+1 and f(Xn). I can see that the difference between Xn and Xn+1 is getting smaller and smaller while f(Xn) is getting nearer and nearer to 0 which indicates the distance from the required root.
~~~END OF APPENDIX A~~~
P2 Coursework
Cody Tang
- 1 -