
I intend to see if these theories can been seen to affect sphere of influence of real settlements in Essex and the Lake District. The theories I am going to test are on range, accessibility, size of settlement, and tourism function.
I intend to see if these theories can been seen to affect sphere of influence of real settlements in Essex and the Lake District. The theories I am going to test are on range, accessibility, size of settlement, and tourism

The normal distribution
The normal distribution When many measures are taken of something (eg, scores in a test, people's heights, pollution levels in rivers) the spread of the values will have a bell shape, called the normal distribution. A number of statistical tests use this characteristic distribution (or dispersion) of values to test whether two samples are the same or different. There are several basic terms that are commonly used with the normal distribution. Average (mean) A measure of the average score in a set of data. The mean is found by adding up all the scores and then dividing by the number of scores. Range The difference between the largest core and the and smallest score. Median If a set of scores are arranged from lowest to highest the median is the score in the middle, with half above and half below. Mode The value that occurs most often Standard deviation s A measure of the standard (average) deviation of the scores from the mean.The larger the standard deviation the larger the range of values/variation in the data . Subtract each score from the mean 2. Times each difference by itself (negs turn positive) 3. Add up all the squared differences 4. Divide the total by the number of scores minus 1 5. Take the square root Standard deviation The normal distribution at right shows the percentage of scores/observations that lie within one, two or three standard

Anthropometric Data
Coursework portfolio-Investigation 2 Using and applying statistics Anthropometric Data During this coursework I will be investigating the relationship between two of the data types. The main point of this coursework is focusing on the linear regression. Data was taken from Blackboard which contains anthropometric data from a large sample of children and young adults. This date result was taken in USA by the Consumer Product Safety Commission (CPSC). From this information given I can observe that there may be some errors due to data input in the result taken, it may be that the data was collected in 1977 and during these times some techniques used in collect may be inefficient, some value may be incorrect due that it is a secondary data. Has there will be some limitation in using the data again. From the data obtained I have decided to choose foot breadth and foot length has I feel that this information will be useful to design children soaks which could be sold in retail outlets. The chosen age range from 2-2 1/2 years of age. This will be targeted at female in their gender group. Table to showing 30 sample of foot length (mm) and foot breadth (mm) Female FOOT LENGTH (MM) FOOT BREADTH (MM) AGE (MONTHS) 31 62 24 32 60 24 23 53 24 34 53 24 35 59 24 35 56 24 56 58 24 31 53 25 40 60 25 37 60 25 37 56 25 19 52 26 42 63 26 40

Maths GCSE Statistics Coursework
Introduction I have been asked to compare 173 year 7 pupils and 178-year 11 pupils who were asked to estimate the length of a bamboo stick to the nearest centimetre, which was held horizontally not vertical. I am going to investigate the two different age groups to see who had the more constant guesses from the secondary data, I have been given. The actual length of the bamboo stick is 1.58 metres. As 351pieces of data would be too big to sample, I am going to random sample 50 pieces of the data for each year. Not to be biased I am going to stratify my data to keep the boys and girls in proportion. Hypothesis 1 I predict that the ability to accurately guess the length of the bamboo stick will increase by age group; this implies to me that the overall average year 11 guess will be close to the actual length than the overall average of the year 7 guess. I think this because as the year 11 pupils are older they would have had more experience with numeric problems and would be more mature than those in year 7 would. With this, I expect there to be more extreme data from year 7 than year 11. Plan In order to show that year 11 are better guessers than year 7 I will have to find the average for each year group and the group closer to 1.58 metres will be the better guessers. I will calculate the mean for each year group and then I will verify this result by finding the median

Analyse some of the statistics of the National Lottery (especially sales information), and see whether there are any trends, similarities, patterns, or correlations in the data.
The National Lottery Introduction Aims The Aims of this Project are: * To analyse some of the statistics of the National Lottery (especially sales information), and to see whether there are any trends, similarities, patterns, or correlations in the data. * To check whether some of the statistical variables surrounding the National Lottery fit a known statistical distribution. How the Statistics Were Collected The statistics were collected from the Internet. I originally found complete information on the first 187 lottery draws, but decided that this was too many to be easily manageable. Therefore I decided to randomly select 50 draws from this set of information. I used my calculator to generate random numbers from 1 to 187 (without generating previous numbers), and used this to select a final table of data which contained 50 randomly selected lottery draws, which I then sorted by draw number. The data will be reproduced in portions throughout the project. No difficulties in collecting data were encountered. How the Lottery Works People who play the lottery pick six different numbers on a ticket from the range 1 to 49. Any person can play the lottery as many times as they like, but each ticket sold counts separately in the final statistics. Six numbers are selected using a machine which selects six 'random' balls from a
Descriptive Statistics 1. Mean, median and mode.
Descriptive Statistics 1. Mean, median and mode. Introduction At this stage I want to emphasize the practical relevance of averaging, using the discussion of the mean to illustrate the use of mathematical notation (that was introduced last week), and warn you about some of the possible pitfalls of relying on the average without looking at the pattern of values from which it was calculated. First, however, I will attempt to answer the good question, "why bother learning statistical notation", that seems to crop up every year. Why learn mathematical notation? PSY107 aims to provide not just a recipe book for doing statistics problems in isolation, but aims to leave you with some skills that have general relevance. These include computer literacy, the ability to explore data, critical thinking, and a degree of independence in tackling statistical issues in Psychology and elsewhere. The routine tools that I and many of my colleagues use to do statistics are not algebra and equations, but (often computerized) graphing and data analysis methods. I think that many simple statistical concepts can be communicated using graphs and plain English. Why, if many psychologists do not spend their time writing µ and ? is it necessary to get to grips with the basics of statistical notation? This question has several answers. First, mathematical language is logical, rigorous, and

Statistics: Survey of Beijing and China during the SARS storm
Year 13 Statistics Project: Survey of China during the SARS storm Written By: Junjie Zhou MT. ALBERT GRAMMAR SCHOOL TABLE OF CONTENTS Part A: introduction Planning General situation of each disaster area. General situation of the China mainland. The trend of SARS developed in China mainland. Part B: investigation Background Aim Hypothesis Method Results . Analysis of data 2. Graphic analysis Comparison of sample and China mainland . Analysis of data 2. Graphic analysis Discussion and conclusion Part A: Introduction Planning Original idea I want to investigate the relationship between the sample and the China mainland. The relationship between those reflects how does the time affect SARS trend in China. Objectives March and April are the most important point in the SARS list. SARS is a very harmful disease, so the death number is the factor that reflects the situation. Research http://www.sars.china.com..cn/ Part B: investigation Background: The first SARS event happened on the February of 2003. SARS is a disease, which spread very rapidly. Guangzhou located at southern part of China, it is the biggest economic and cultural center in southern part. The weather of this location is very hot. And population is big. The first event about SARS is found in this location. Beijing is located at northern part of China. As the capital of China, it

Standard addition was used to accurately quantify for quinine in an unknown urine sample containing approximately 100 ìg cm‑³ of quinine.
Instrumental Methods of Analysis Determination Of Quinine In Urine By Fluorescence Spectroscopy Name: Andrew Holmes, Tana Epsom and Rachel Nicholls Course: BSc Forensic Science Year: 2 Unit: Instrumental Methods of Analysis Date: 09.10.02 Summary Standard addition was used to accurately quantify for quinine in an unknown urine sample containing approximately 100 µg cm-³ of quinine. The fluorescence intensity of each standard addition solution was measured using a fluorescence spectrophotometer. The result was found to be that the unknown urine sample contained a concentration of 121 µg cm-³ of quinine. This was found by extrapolating the data on the standard addition graph of the variation in fluorescence with added quinine sulphate concentration. Aims: * To determine the variation in fluorescence with quinine sulphate concentration of standard addition solutions. * To determine the quinine sulphate concentration of an unknown urine sample. * To assess the data and judge whether other components of the urine interfere. * To adhere to all safety regulations required when working in a laboratory. * To carry out the experiment to a high level of accuracy. * To employ standard addition techniques. Introduction Fig.1 Structure Of Quinine Quinine is a white solid, C20 H24 N2 O2.3H2O. It is a poisonous alkaloid found in the bark of the South American
Investigating Growth in Stride Length During the Human Growth Stage
Investigating Growth in Stride Length During the Human Growth Stage Aim The aim of this investigation is to test the hypothesis that the stride length of a human being, during its growth stage, increases as they age. I chose to investigate pupils in years 7 and 12 at my school as their ages are far enough apart to produce data that should show significant changes in stride length. This investigation was initially prompted by personal experience, because at age 17 my relatively short legs and stride have caused me problems in driving and purchasing clothes. It would seem that manufactures are not catering for people of my size/age, as they appear to be basing design decisions on data that is producing a 'mean' that discriminates against myself and others. Data Collection The population for my investigation is all the pupils in years 7 and 12 at my school, which is an all girls' school. Restricting my selection to just girls in my school has not sacrificed quality because it would have been misleading to include male measurements in the data as they have very different growth patterns. Also my school has a good representation of girls of the same age ranges. I chose a sample of 30 pupils from each year group using systematic sampling. I chose this method of sampling as simple random sampling would have been very tedious and time consuming because I would have had to
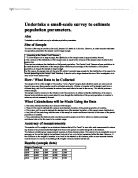
Undertake a small-scale survey to estimate population parameters.
Undertake a small-scale survey to estimate population parameters. Aim Undertake a small-scale survey to estimate population parameters. Size of Sample The size of the sample must be quite small, because it is stated so in the aim. However, to make accurate estimates of population parameters the sample must be large enough. According to the Central Limit Theorem: n If the sample size is large enough, the distribution of the sample mean is approximately Normal. n The variance of the distribution of the sample mean is equal to the variance of the sample mean divided by the sample size. These are true whatever the distribution of the parent population. The Central Limit Theorem allows predictions to be made about the distribution of the sample mean without any knowledge of the distribution of the parent population, as long as the sample is large enough. For this reason, the sample size will be set at 50, which I consider large enough for the distribution of its mean to be normal (according to the Central Limit Theorem). It should not be larger because the aim of this investigation is to carry out a "small scale survey" How / What Data to be Collected The sample will be of the weight of 50 smarties. To be a "good" sample, that is that the results are valid and not biased in any way, these smarties must be collected randomly. 10 tubes of smarties will be bought, each