Investigation into the relationship between P1 exam results and A-level results
Investigation into the relationship between P1 exam results and A-level results Aim My aim is to investigate the relationship between scores in the P1 exam and the final score obtained in the A-level exam. I have obtained a table of 249 students which tells me their results in the P1 exam and their final mark for the A-level, from the school's maths department. I wish to investigate this relationship as I have taken my P1 exam and will be completing my A-level maths year. This would give me a good indication of what my result could be like. Also, in the future this investigation could be used by teachers and students to assess whether it is fair to base a prediction of the likely A-level maths result on the P1 result. I hope then to prove convincingly whether the P1 exam result is correlated with the final A-level result, and to what degree is this correlation. Data Collection My population is all the students taking A-level maths from the MEI syllabus over the last 5 years. However, I cannot obtain all these results because of several reasons. Firstly I do not have the resources to find all the schools taking A-level maths in this syllabus and some of the colleges may disclose their results to me. This would also require more time perhaps several months before I would be able gather all the results. Therefore I have restricted my population to students at Trinity

Investigate the prices of second hand cars and the factors that may affect the price.
MY PLAN I am going to investigate the prices of second hand cars and the factors that may affect the price. These factors could come from a last list including mileage, engine size, age of vehicle, months of MOT and how much tax there is on the car. I shall analyse this data so that I can decide which factor has the biggest affect on a car's price. I will use graphs and charts to help with my explanation. COLLECTING THE DATA From a list of 100 cars I decided to do a selective sample of 20%, so I chose every fifth car as this will be a good spread. 20% should be a good sample size because there will be a good spread of data and, therefore, I should get accurate results. This will only be a rough test to see if the cars are close enough in similarity for me to draw any results from them (see appendix 1). HYPOTHESIS 1 "Age of car will affect price" I thought age was one of the biggest factors that would affect car prices. First of all I calculated the % depreciation of all the cars in my sample. I calculated the % rather than straight monetary loss because it helps smooth out the extremes between car makes eg Bentleys and Ford. I did a scattergraph (appendix 2) of age against % depreciation and then drew a line of best fit. This showed a strong positive correlation that the older the car the more value it loses. This shows that my Hypothesis 1 is correct.

Fantasy Football - Maths Coursework - Statistics
Fantasy Football - Maths Coursework - Statistics My coursework is based on the game 'Fantasy Football' which is ran by the British newspaper called 'The Sun'. Fantasy Football is a competition based on building your own 'dream team' and collecting points to try and have the most points at the end of the season with your team, to win the cash prize. All the players from the English Premiership are used and a scoring system is used to see how well the players are doing and who has picked the best eleven players for their team. You are allowed to create your own team consisting of 1 goalkeeper, 4 defenders, 3 midfielders, 2 attackers and a 'sub' which must be either an attacker or midfielder. All the players are valued depending on how well they play and the number of points they have from last season. Competitors have a total of £40million 'money' to spend on their players. A scoring system is used and players can both gain and loose points. The points for all the players on your team are added up at the end of the season and the competitor who has the team with the most points wins. I am going to find out how to pick the top-scoring team and I will do this by using last year's scores. I will use the 2003 scores as they were at the end of the season. I will not be including goalkeepers in my investigation because they have a different scoring system to defenders,
Bivariate Data Exploration
STATISTICS 2: Bivariate Data Exploration Aim: The aim of this investigation is to see if there is a correlation between the engine size of a car and the insurance group that it resides in. Introduction: In our present day there is an ever-increasing public demand for value-for-money products and services, especially in cars, shopping and clothing markets. For students, this is even more important as everything they buy (unless they are particularly affluent) can easily amount to debt (through extensive student loans). For students in particular, cars are very often an essential means of transport, and so, like most things, it is important for a student to get the best deal for their car. However, insurance companies and car dealers are very much aware of the student situation and have classified certain cars as 'student cars', and to clarify this, include cars from Peugeot (106, 306), Renault (Clio), Citroen (Saxo), and Vauxhall (Nova) to name but a few. Now it seems that these cars all have relatively low engine sizes, commonly ranging from 900-1800cc, and are all placed in relatively low insurance groups (and therefore have lower insurance costs), but this may not be the case for all cars, especially those with larger engine sizes. This investigation will examine data from a range of cars, varying in both engine size and insurance group, and if a positive
Guestimate - investigate how well people estimate the length of lines and the size of angles.
Guestimate - Statistics Coursework We have been given a piece of Statistics coursework called 'Guestimate', that asks us to investigate how well people estimate the length of lines and the size of angles. I started my investigation by creating these 3 hypothesis: . Students in year 10 estimate angles better than students in year 7. 2. The population find it easier to estimate horizontal lines than diagonal lines. 3. The population estimate the length of lines more accurately than the size of angles. I tried to choose three different hypotheses to avoid sticking to one particular topic. These are my reasons for choosing each of my hypothesis: . Year 10 students have been studying angles longer than year 7 students and should be more conscious of the subtle differences between them. Also they will recognise obvious angles such as 90 degrees and use them as a base for other angles close to them. 2. Horizontal lines are seen and used more often than diagonal lines. They also look shorter than diagonal lines and are easier to estimate because of this. 3. People draw lines more often than uncommon angles (angles that are not 90, 360 or 45 degrees) and will be better at estimating something familiar. There is a total number of 360 students in year 10 and 7.This is too large a population to collect data from, so I will take a smaller sample of 30 students from each year.
Distribution of the weights of two types of sweets
Distribution of the weights of two types of sweets The aim of this investigation is to collect data from a population and using the results estimate population parameters i.e. mean. To collect my data I am required to measure one factor of the chosen population, these factors include: * Heights * Weights * Pulse rates * Reaction times of males and females * Age group's etc. I have decided that my population will be two types of sweets and the factor that I am going to measure is the weights of each individual sweet. The two types of sweets I have decided to use are: * Galaxy Minstrels * Maltesers When collecting my data I will have select an appropriate method to obtain the information that I require. There are two methods in which data can be collected: * Survey - used to determine some particular characteristic(s) of a population, usually done through questionnaires. * Experiment - used to test a factor when that factor is the only variable. The most suitable method to use to measure the weights of individual sweets is by doing an experiment. It would be impossible to collect the weights of each sweet in the whole population a sample of the population must be taken. A suitable sample size must be chosen which will allow me to obtain reliable data in which I could draw a conclusion from. Hence, I will be using a sample size 100 of each type of sweet, as this

Investigation into Relationship between Volume and Diameter in Sand Piles
Key Stage 4 - Assessment Ph2 - Sand Piles i) Investigation into Relationship between Volume and Diameter If sand is allowed to fall steadily onto a horizontal, level, and flat surface, it forms conical piles. Our AIM, in this experiment, is to find the effects, on the diameter, caused by varying the volume these conical piles of building sand, and hence, find their relationship with one another, in terms of a graph showing all possible, plausible volumes, applicable in the laboratory, with their respective outcomes. There are two predictions to discuss, the first being the qualitative prediction, explaining itself in simple, common sense terms, followed by a quantitative prediction. Qualitative Prediction: As the volume of the pile increases, I would expect the diameter to increase; this I observed, when I was travelling to school, and saw piles of building sand, cement, grit, and other building materials on the sites. Everyday, when I passed, the piles would get smaller, as the materials were gradually used up, but not just in height and volume, but their diameter also. The piles did not remain the same stature and get thinner everyday, instead, they got smaller in every dimension, and so I deducted that all the different sand piles were similar cones, and therefore had the same similar triangles in profile. Quantitative Prediction: V = 1/3?r2h = 1/3?(d/2)2h =

The aim of this project is to find out which factors affect the selling price of a house.
Maths Coursework Introduction The aim of this project is to find out which factors affect the selling price of a house. I have been given four districts, and in each there are four streets. In each of the 16 streets there a number of houses which the previous factors effect and result in a different house price. In the data presented I have found several rogue results (results that do not fit in with the rest of the results). If these were to be kept, the results would be biased and so these rogue items must be removed. The rogue items were £475, 000 in house price, 13,000 in squared ft and 20 in number of bedrooms. They are too large to fit in with the other data. The ranges (highest - lowest values) where £161, 800 in house price, 2900 in square ft and 6 in number of bedrooms. 27% of the homes had a large garden, 62.5% had a small one and none was 10%. In Garages 68% had a garage and 32% didn't. In order to get an idea of the nature of this data I have been given, I will divide Price into suitable groups and draw a histogram. Then I will make a cumulative frequency table and draw a cumulative frequency curve. I will then state my median and the inter-quartile range for my cost, as outliers do not affect them. Out of the fields given, some of these affect the price of the houses. The fields that will affect the house price are if the house has a garden, if the house has

Probability of Poker Hands
Table of Content Subject Page # Introduction Probability of getting no pairs (five different face values, not in sequence, not all cards in the same suit) 2 Probability of getting one pair (two cards of one face value and three cards of different face values, none matching the pair) 6 Probability of getting two pairs (one pair of each two different face values and a card of a third face value) 8 Probability of getting three of a Kind (exactly 3 cards of one face value and 2 different cards) 0 Probability of getting a straight (five cards in sequence, but not all the same suit) 2 Probability of getting a flush (five cards of the same suit but not in sequence) 4 Probability of getting a full house (three cards of one face value and two cards of another face value) 6 Probability of getting four of a kind (four cards of one face value and one other card) Probability of getting a straight flush (five cards in sequence of the same suit) Conclusion Work Sited INTRODUCTION Probability of getting no pairs Five different face values, not in sequence, not all cards in the same suit A no pair, also known as a high card, occurs when a player has a set of five cards that are not in sequence, have five different face values, and that they are not of the same suit. No pair is the lowest ranked poker hand, and if all players have no pair, the player with the highest
I believe that year 10 pupils will be better at estimating the length of a stick than year 7 pupils are.
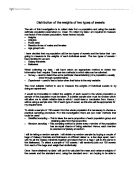
Statistics Coursework Hypothesis I believe that year 10 pupils will be better at estimating the length of a stick than year 7 pupils are. I think this because year 10 pupils have more experience, and also I fell I was better at estimating in year 10 than I was in year 7. Plan All my data in my experiment was collected for me. A teacher went into every class in years 7 and 10 and held up a stick of 1.36m horizontally. The pupils then had to estimate how long they though that stick was. The only piece of information that the pupils were given was that a door is about 2 meters high. To see if the year 10's are better than the year 7's are at estimating length I will work out the mean, median, mode and standard deviation. I will then draw tables and graph for year 10 and year 7. I have to make sure that I take an equal sample of both year 7 and year 10; I will take a random sample of 20% of each year. This will mean that I will have 72 data values in all. Aim My aim is to be able to gather enough information so that I can prove my hypothesis true or false. I will have to compare the averages of my results from year 7 and year 10. This will then give me a better idea of the difference between them both. If this shows that year 10's estimates are closer than year 7's then I will have proven my hypothesis right. Sampling There are 182 data values in year 7