Method
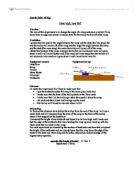
- The piece of wood was positioned to rest at one end on the table, point C, and the other end on the stack of books, point E.
- The light gates were plugged into the computer and set to test the velocity of the trolley between the light gates at points A and B.
- The 10cm card was then attached to the trolley with blu tack.
- The light gates were positioned to be 40cm apart, at points A and B and tested to check that they worked.
- Once everything was set up and the light gates working effectively, the height of the stack of books was altered to make the distance between points A and F 3cm to begin with. This was done by measuring the distance between points A and E and subtracting the distance between points B and D. The number of books in the stack could then be altered as required.
-
The trolley was allowed to roll down the slope from point A, giving an initial velocity, u, of 0. No other force was applied so the acceleration of the trolley was purely due to the gradient of the slope and the force of gravity.
- The experiment was repeated four times for each gradient.
Evaluation
The equipment used was chosen because of the accuracy and smallest possible error. The light gates were used to measure the velocity of the trolley between points A and B because they were the most accurate way of getting the measurements. As the speed of light is so fast, the error associated with the light gates is negligible. It also meant that the results would not be prone to human error. The computer was able to make the calculations with the data gained from the light gates quickly and effectively, meaning the experiment could be carried out efficiently.
The wood used for the slope had to be as smooth as possible to make the results accurate, as any warpage could alter the velocity of the trolley. This would result in an inconsistent gradient and therefore an inaccurate experiment.
A ruler was used to measure the height of the raised end of the slope, the length of the card on the trolley and the distance between the light gates. The error associated with the ruler is. This means that the measurements could be up
to away from the true value. This inaccuracy is not huge, so the results are reliable. The biggest problem with using a ruler is the parallax. In doing the experiment, the measurements were consistently taken from the same angle of vision thus reducing the effect of the parallax. This effect, however, could have been reduced slightly further by using a piece of paper on the table top, perpendicular to the ruler, to use as a better guide to an accurate measurement.
The percentage uncertainty in measuring the height of point A was reduced as the ramp was raised. This is because the measurement increased whilst the error remained constant, making the ratio between the two increase.
The time for the trolley to get from point A to point B could have been reduced by increasing the distance between the two points. This would have lessened the effect of the uncertainty, as the ratio between the two values would have been increased.
The wheels on the trolley add complications to the effect of the angle of the slope on the velocity of the trolley. This is because the smoothness of the wheels to rotate would have changed the outcome of the experiment and added to the friction.
The angle of the slope was calculated using the height of the raised end of the slope and the distance between the light gates. This was a much more accurate way of finding the angle than using a protractor. Using a protractor could be potentially very problematic because the table was in the way and it would have been awkward to measure.
Evaluation of graph
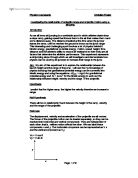
The graphs show the expected trends in the data. The Graph 1 shows that the velocity of the trolley increases with increased height of the slope. The increase is linear with a strong positive correlation and provides evidence for the expected results.
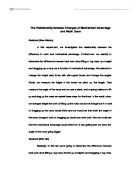
Graph 2 shows that as the angle of the slope is increased, so does the acceleration of the trolley. This supports Galileo’s equation: . The trend, however, is not constant. The graph shows a steep difference in the effect of the gradient of the slope from to . There is a linear trend in the results however the final acceleration, at , appears to be an anomaly as it creates an unexpected and unexplained increase in the gradient at the end of the graph. This is likely to be due to inaccurate results or experimental errors.
Conclusion
My hypothesis that the height of the slope, and therefore the angle, would largely affect the velocity and acceleration of the trolley is supported by the experiment results.
The results show the trends expected when relating the velocity of the trolley to the angle of the slope. They agree with the equations and and give data that shows the proportionality expected between the velocity of a trolley down a slope and the angle.
Graph 1: A graph to show the effect of the height of the slope on the velocity of the trolley
Graph : A graph to show the effect of the angle of the slope on the acceleration of the trolley
Results
Constants:
The distance between the light gates was kept at 0.4m throughout the entire experiment. The card that was attached to the trolley was also the same, at 0.1m.
Height 1: 0.03m Height 2: 0.04m
Height 3: 0.05m Height 4: 0.06m
Height 5: 0.07m
Calculating the angle of the slope
Height 1: 0.03m
Height 2: 0.04m
Height 3: 0.05m
Height 4: 0.06m
Height 5: 0.07m