Results
Preliminary Experiment Diagram
These results tell me that when the temperature was increased the current increased and therefore the resistance must decrease (R=V/I)
To calculate the resistance in the next experiment I will also measure the Voltage using a voltmeter. I need to do this because although I am keeping the voltage the same on the power pack this may not be accurate due to the change in resistance round the circuit.
Plan
Apparatus-
Ammeter
Thermistor
Bunsen burner
Tripod
Clamp stand
Clamp
Gauze
Thermometer
Beaker
Water
Power pack
Wires
Crocodile clips
Voltmeter
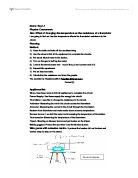
I will set up the equipment as shown in the diagram.
I will fill the beaker with water of room temperature.
I will light the Bunsen burner and when the temperature reaches 250C will read the current through the thermistor and the voltage across it and record them.
I will do this at each 50C interval up to 1000C.
I will repeat the whole experiment three times to achieve the most accurate results I can.
Each time I repeat the experiment I will make sure I use the same thermistor.
For safety I will stand up whilst doing the experiment ,wear safety glasses, I will tie my hair back and I will follow the normal lab rules.
I will measure the temperature, voltage and current.
The start temperature will be 250C because from my preliminary experiment I found this to be the point where the current was changing enough to draw reasonably accurate results. The step size between temperatures will be 50C because this is what I used in my preliminary experiment and I found that it gave me a good number of points to plot.
The stop temperature will be 1000C because I want to measure as high as I can so as I can see the bigger rises in current. I have to stop at 1000C as water can not be heated past this in a beaker.
To plot the graph resistance, I will find the resistance readings by dividing the voltage by the current at each point. Then I will find the average for the three experiments at each point and plot it on the graph. I will plot the resistance against the temperature.
Prediction.
I predict that when the temperature of the thermistor is increased the resistance will decrease.
I think this because when a thermistor is heated there two competing effects which are; a) that, as in a wire, the lattice atoms vibrate faster and collide with the flow of charge ( which is the flow of free electrons) slowing it down and reducing the current. And b) that because it is a semi conductor the outer electrons get more energy as it is heated and are freed, they and then free to conduct current.
I think that the second effect will be stronger because it increases the number of charge carriers. The second effect it stronger and this means that less of the current is stopped when the temperature increases and therefore the resistance goes down.
If the first effect was isolated and there was no competing effect, as in a wire, the resistance would increase as the temperature increased. When the lattice atoms collide with the flowing current it reduces the current meaning that it increases the resistance.
I predict that the graph will be a curve. I think this because at a low temperature there are lots of electrons which can be freed as the atoms start to vibrate more. At a higher temperature the atoms have less electrons which can be freed as some have already been freed. Therefore I think that the reduction in decrease will be largest at low temperatures and then get smaller as the temperature rises.
Experiment Diagram
Results
Analysis
From my graph I can clearly see that as the temperature increases the resistance decreases. This is because as the thermistor increases in temperature the lattice atoms move faster and are colliding with the electrical current and slowing down the flow of charge. In a normal wire this would make the resistance decrease but because a thermistor is a semiconductor there is a second stronger effect which out weighs this. This effect means that the outer electrons are not free at room temperature but when heated the get more energy and are freed. This means that there are more electrons available to conduct. This does not apply in a normal wire because the outer electrons are free and the inner electrons are tightly held in the atom. The two competing effects in the thermistor mean that when the temperature is increased the resistance decreases. If the resistance decreases then the current increases.
The graph shows the resistance dropping from about 300 ohms to about 50 ohms.
This is a drop of 250 ohms. The temperature went from 250C to 1000C. By 500C the resistance has already dropped to about 50 ohms which is half the decrease in ohms under a third of the rise in temperature which proves that the resistance decreases most at lower temperatures and less at higher temperatures. This is as my prediction. It is because at a low temperature there are lots of electrons which can be freed as the atoms start to vibrate more. At a higher temperature the atoms have less electrons which can be freed as some have already been freed. Therefore the reduction in decrease will be largest at low temperatures and then get smaller as the temperature rises.
These results support my prediction because the line of best fit is a curve showing the resistance decreasing as the temperature rises.
Therefore the gradient is greatest at about 300C when there are lots of electrons to be freed and the gradient is smaller at about 1000C when the electrons have been freed.
Evaluation
I thought the theory behind the experiment quite complex as it involved two competing effects but I found the experiment itself quite straight forward and easy. Our results are reliable enough to support my prediction and to draw a detailed analysis. They are reliable to a reasonable degree of accuracy because we took three results and then found the average. We also know they are quite accurate as the line of best fit goes close to all the points. In the three experiments we did the resistances were very similar with very little disparity between them which shows the experiment was precise. There is only one clear anomalous result which is at 300C I think this is because the thermistor had not got the a high enough temperature for many of the atoms to free electrons. Sources of error could have been that between experiments the thermistor or thermometer did not cool down properly to the same temperature. If this was the case it did not have a big effect on the results as the reading in the three experiments are very similar. Other sources of error could have been the our reading of the thermometer. It was difficult to read the ammeter and voltmeter at the sama time as looking at the thermometer and I could not have read the voltmeter and ammeter at exactly the same time. I did the experiments over two lessons so I made sure I kept the same thermistor but I could not keep the same thermometer, ammeter or voltmeter which may be the source of some error. The other results are all close to the line of best fit but I could make it better by doing more experiments to take the average resistance from, use a more accurate voltmeter and ammeter or use a data logger to record the results. To build on this experiment I could investigate what would happen after 1000C and see if the resistance would start to increase again after the thermistors atoms have lost all their outer electrons and the lattice atoms continue to move faster slowing down the flow of current. I could not use water to do this as water can not be heated beyond 1000C, I would have to use a liquid with a higher boiling point such as oil. For this experiment I would set up the equipment in the same way but use oil instead of water and continue beyond 1000C. I could also investigate whether the length of a wire had an effect on the resistance of the circuit there would be more lattice atoms and may be a higher resistance.
I would also like to try lower temperatures to see if there was a minimum energy needed to free the electrons if so the graph would be-