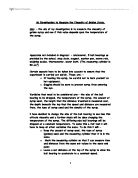
In this experiment we had to investigate how the power dissipation of a filament lamp varied with different potential differences across the circuit.
Experiment to find the relationship between power Applied and potential difference Introduction In this experiment we had to investigate how the power dissipation of a filament lamp varied with different potential differences across the circuit. Also to find a relationship between the power and potential difference, from this information draw a graph and collect suitable results. Method I connected a power supply to a filament lamp (10v maximum output) this was then connected to an amp meter this was then connected back to the power supply. The voltmeter was connected in parallel. Then I set the power supply to 0v then turned it on then increased the voltage in 1 volt stages starting at 1 volt and finishing at 8v taking the readings from the amp meter and recording them on a table. I repeated this part twice to make sure my readings where accurate and also to give me and average reading. From this we then calculated the power by multiplying the current by the potential differences. And then on excel working out the log of volts and the log of power and composing a graph. Results The result from this experiment shows that there is a linear relationship between the voltage across the circuit and the power. The graph produced is a straight line graph that goes through the origin. On my graph there are some anomalies but these are very small variations that are not

Power Output of a Solar Cell
Is the power output of a solar cell proportional to the sine angle between the incident light and the face of the power cell? The experiment that will be conducted is to see whether or not that there is any connection between the sine angle of light and the power output of a solar cell. Hypothesis The hypothesis for my experiment is that the power output of a solar cell is directly proportional to the sine of the angle between the incident light and the face of the solar cell. The sine of the angle of incidence and the face of the solar cells direction ? to the power out put OR Sin ? ? Pout where ? equals angle of incidence Prediction I predict that the results, when plotted on a graph, will show a strong positive correlation between the total power output of the solar cell that is proportional to the sine of the angle at which the light is shone at the solar cell. Variables Any Indirect light coming from another light source could affect the experiment. Wire temperature causing an increase in resistance Apparatus I will use two digital meters set on 200mA and 2mV range that will allow results to be measured to the nearest 1mA and 1mV respectively. Also a resistance box will be set on a resistance of 50? to try and keep the resistance level during the experiment. A standard lamp powered by mains electricity with a 60W bulb will be used as a light
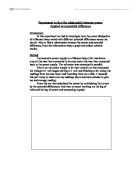
Investigate the properties of a sensor.
SENSORS COURSEWORK PLAN: We were asked to investigate the properties of a sensor. The sensor I have chosen is a potentiometer. A potentiometer is a device which taps off a fraction of its input to provide a controlled output. It consists of a sliding contact which moves across wire coils to cause a change in resistance. Equal movements of the sliding contact give equal changes in output. We are actually using the potentiometer as a variable resistor so that instead of tapping of a proportion of the potential difference it taps off a part of the resistance. We are using a rotary potentiometer for our experiments. This means that the slider moves in a circular motion across the contacts. For us to be able to conduct tests we must be able to accurately measure how much we have moved the contacts so that we can compare it with the change in resistance. We have decided to measure the movement in degrees. This means we had to fix an arm to the moving contact of the potentiometer so that we could see the moving part of the potentiometer. Then we had to draw a circle on some card and mark of the degrees using a protractor. We then mounted the potentiometer on the card so that it was held firmly in place. This meant that now we could see how many degrees movement gives a certain out put. There are a number of things which we can investigate about the potentiometer: Resolution

Solar cells
Solar cells This case study involves researching about solar cells and study the effect internal resistance has on its efficiency. This ties up with our practical investigation where we investigate the internal resistance of a power supply. Sunlight can be converted into electrical energy using photovoltaic cells also known as solar cells. Photovoltaic (PV) cells are made of materials called semiconductors such as silicon. When light strikes the cell, a certain portion of it is absorbed within the semiconductor material1. The energy absorbed by the semiconductor from the light knocks electrons loose, allowing them to flow freely thus making an electric current. Unlike on Earth, there is no atmosphere in space blocking sun light so there is a good supply of sun light energy if positioned correctly, but the disadvantage is that the longer they stay exposed to extreme high temperature the more likely for them to get damaged. Temperature also has a major impact on the internal resistance of the solar cell. This could be detrimental to the space program being undertaken. In this case study, I aim to investigate the internal resistance of a power supply and link the results to a power supply in space i.e. a solar cell. By studying the relationship between external load on current and voltage, the internal resistance of a power supply can be determined. Knowledge gained can be
The experiment involves the determination, of the internal resistance of a cell.
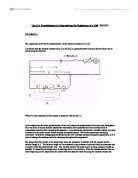
Use of a Potentiometer in Determining the Resistance of a Cell 29/01/00. Introduction The experiment involves the determination, of the internal resistance of a cell. It is known that the internal resistance (r), of a cell (Eo) in a potentiometer circuit as shown below can be found using the formula: r = R( ( lo/l) -1) Where R is the resistance of the resister in parrallel with the cell Eo. In this experiment the same galvanometer, driver cell jockey and potentiometer wire were used throughout. This was done to ensure that the experiment was kept as fair as possible and was not biased due to misreadings resulting from changing the apparatus. Also during the experiment a variable resister was used to make sure the same current flowed through the potentiometer. Whilst the experiment was being conducted. So that the voltage gradient (k) across the wire was kept constant during the experiment, as if k were to change the readings would be changing throughout the experiment. The things that were varied in the experiment were, the resistance in parallel with the resister and the balance length (lo). The balance length will be measured using a meter rule placed directly underneath and in parallel with the potentiometer wire. The variable resister was used to give as large a balance length as possible. To keep the percentage error in readings, down to a minimum.

Investigate the effect of strength and current using an electromagnet by how many coils you put on it and by changing the voltage.
An Investigation into Electromagnets Aim- I am going to investigate the effect of strength and current using an electromagnet by how many coils you put on it and by changing the voltage. Apparatus- Power pack, Wires, Crocodile clips, Ammeter, Coils, Paper clips (staples), Variable resistor Prediction- I think that the more current that goes through the wire, the greater the electromagnetic pull of the iron core will be. This is because the current going through the wire makes the iron core the factor that induces electromagnetism, as so when there is more current, there will be more electromagnetism. This is the same with the number of coils around the electromagnet, the more power is returned so therefore the more paper clips will be picked up. Plan- The two variables are the number of coils and increasing the current. I am going to keep the voltage constant in the first experiment and keep the number of coils the same in the second experiment. The factors that affect the strength of an electromagnet are: The temperature, current, length of the core, diameter, the thickness of the wire used for the coils, how tightly the coils of wire are wrapped around, the material and also the number of turns on the electromagnet. Method- I got all my apparatus out and then I connected the wires up to the variable resistor and the voltmeter and then I connected
PID Control Case Study - Balanced beam demonstration
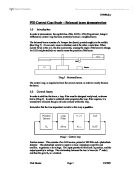
PID Control Case Study - Balanced beam demonstration .0 Introduction In order to demonstrate the capabilities of the AN20, a PID (Proportional, Integral Differential) control loop has been created to balance a weighted beam. The balanced beam consists of a Perspex bar (beam) pivoted roughly in the middle. (See Diag.1). At one end a mass is attached, and at the other a metal disc. When current flows in the coil, the disc accelerates, causing the angle of the beam to change. An LED and photodiode are used to sense the position of the beam. Diag.1 - Balanced beam. The control loop, is required to force the correct current, in order to exactly balance the beam. 2.0 Control theory In order to stabilise the beam, a loop-filter must be designed and placed, as shown below (Diag.2). In order to establish what properties the loop-filter requires, it is necessary to calculate the gain of each element within the loop. Remember that the time dependant variable in this loop is position. Diag.2 - Control loop Position sensor: This consists of an LED source, pulsed at 100 KHz and a photodiode detector. The photodiode current is input to a trans-impedance amplifier and rectifier, to generate a dc voltage. The input quantity to this block is position, and the output quantity is voltage. The relationship between the two is linear (to 1st order) and thus the gain Ks is a
Black Box Electronics Coursework
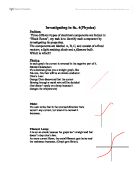
Investigating in Sc. 4(Physics) Problem: Three different types of electrical components are hidden in "Black Boxes", my task is to identify each component by investigating its properties. The components are labeled A, B, C, and consist of a fixed resistor, a light emitting diode and a filament bulb. Which is which? Planing In each graph the current is reversed in the negative part of it. Ohmic Conductor: If a substance gives you a straight graph, like this one, this then will be an ohmic conductor. Ohm's Law: George Ohm discovered that the current flowing through a metal wire will be doubled (that doesn't apply on a lamp because it changes the temperature) Diode: You can notice that in the reversed direction there weren't any current, but when it is normal it increases. Filament Lamp: It is not an ohmic because the graph isn't straight and that doesn't obey ohm's law. As more current flows, the metal filament gets hotter and the resistance increases. (Graph gets flatter). I will do a test for each component once. For each test I will change the resistor 11 times, 5 times at normal resistor and 6 at reverse. Equipment: * Voltmeter * Ammeter * Power Pack * Switch * Variable Resistor For My Safety: . I mustn't keep the power pack appliances running for a long time, because that will heat up the wires. 2. I mustn't plug in too many plugs in a socket

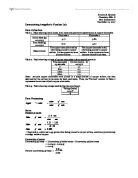
Find the relationship between the current through a resistor and the voltage across it.
MYP Physics Practical - Current and Voltage Aim: To find the relationship between the current through a resistor and the voltage across it. Apparatus: Power pack, Leads, Ammeter, Voltmeter, Resistor (Nichrome Wire) Method: Assemble the circuit shown above. Vary the emf of the power pack from 0 to 12 Volts. Measure the current on the ammeter and voltage on the voltmeter for each value of emf. Data Collection: Thin Nichrome Wire EMF Current (Amperes) Voltage (Volts) 0 0 0 2 0.15 .75 3 0.27 2.5 4 0.38 3.25 5 0.5 4.25 6 0.6 5 8 0.85 7 0 9 2 .2 0.5 Medium Nichrome Wire EMF Current (Amperes) Voltage (Volts) 0 0 0 2 0.38 .6 3 0.5 2.4 4 0.8 3.2 5 4 6 .2 5 8 .6 6.5 0 2 8.5 2 2.35 0 Thick Nichrome Wire EMF Current (Amperes) Voltage (Volts) 0 0 0 2 .3 .25 3 2 .75 4 2.65 2.5 5 3.4 3 6 4.1 3.6 8 - - 0 - - 2 - - Data Processing: Conclusion: From the three graphs above it can be seen in all of them that there is a firm relationship between the two factors, one being voltage and second one being current. Therefore I have accomplished my aim, as I have found what is the relationship between the current through a resistor and the voltage across it. The relationship as can be seen from the graph is positive, and thus directly proportional. This can be seen from the graph itself, because firstly,
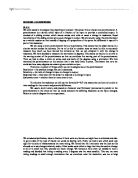
Circuits - To prove the equation: Resistance (Ω) = Potential Difference Current.
Circuits Experiment Aim To see prove the equation Resistance (?) = Potential Difference ÷ Current. This is to be done by setting up a series of circuits containing a voltmeter, an ammeter, cells for the different potential differences, and light bulbs for causing the resistance. Hypothesis I predict that as I increase the amount of bulbs in the circuit the resistance will increase, this is because the electricity must flow through a small filament which has a high resistance already; bulbs have high resistance filaments because they give off more light. I also think that when I increase the number of cells in the circuit, the potential difference will also increase; this is because the cells each have a potential difference on 1.5 volts. Apparatus * 3 Power Cells * Voltmeter * Ammeter * Power leads * Bulbs with a known resistance Method . Set-up a circuit in accordance to the diagram below 2. Record the amps and potential difference values in a results table, then increase the number of cells in the circuit by a value of one each time, making sure to record the amps and potential difference after each change. 3. After adding a total of three cells to the circuit and recording the results, remove the extra cells from the circuit so that it is the same as in the diagram 4. Then increase the number of bulbs in the circuit by a value of one, and record the results