Explain areas of growth or decline in the primary, secondary and tertiary classifications of business activities
Unit 1
(M2) Explain areas of growth or decline in the primary, secondary and tertiary classifications of business activities.
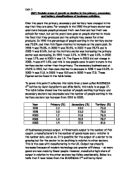
Over the years the primary, secondary and tertiary have changed in the way that they are used. For example in the 1900 the primary sector was used more because people produced their own food and had their own animals for meat, but as the years have gone on people started to trade the food that they produced and the animals they owned for other products. In 1993 the percentage of people working in the tertiary sector was 73.8%, and then this figure started to increase as the years past. In 1998 it was 75.0%, in 2000 it was 76.5%, in 2003 it was 78.7% and in 2005 it was 81.6%, but as the tertiary sector was increasing the primary sector was decreasing. In 1993 it was 2.2%, in 1998 it was 2.0%, in 2000 it was 1.7%, and in 2003 it was 1.4. The figure in 2003 did not change in 2005, it was still 1.4%, and this is how people came to work in more in the tertiary sector rather than the primary. The secondary business was at 24.0% in 1993, but then soon started to decrease in 1998 it was 23.0%, in 2000 it was 21.8, in 2003 it was 19.9 and in 2005 it was 17.0. These figures can be found in the table below.