T-Total Maths coursework
In this coursework I am going to investigate the relationship between T-numbers and T-totals. I will find the relationship between T-number and T-totals by looking at the pattern of the sequence, which goes up by 5 each times when you add the T-total with 5. I will use grids of different size and will translate the T-shape into different positions in order to examine the correlation between them. The T-total and T-number will be translated onto different positions such as 900 clockwise. After the translation of T-total and T-number, I will find the formula that will be devised by putting a careful scrutiny on the pattern of my T-numbers. Aim: The aim of this investigation is to find a relationship between the T-total and T-numbers, but in this case the T-shape can be positioned in different ways, for example upside down or side ways. As the T-shape can also be changed a relationship between the transformations also has to be found. Method: I will first draw out a 9 by 9 grid and put T-shape within it first placing them upside down, then side ways on the right and then also on the left. I will place my results into a table and attempt to find a relationship between the T-total and T-number as I did before. I will incorporate this relationship into a rule using letters and numbers only. I will then do a similar thing for 8 by 8 grids and 7 by 7 grids. In this

Investigating T-shapes.
Investigative Maths Coursework We looked at a T-shape drawn on a nine width grid like this: 2 3 4 5 6 7 8 9 0 1 2 3 4 5 6 7 8 9 20 21 22 23 24 25 26 27 28 29 30 31 32 33 34 35 36 37 38 39 40 41 42 43 44 45 46 47 48 49 50 51 52 53 54 55 56 57 58 59 60 61 62 63 64 65 66 67 68 69 70 71 72 73 74 75 76 77 78 79 80 81 The total of the numbers inside the T-shape is called the T-total. 2 3 1 20 (1+2+3+11+20=37) The number at the end of the stem of the T-shape is the T-number. This remains the same even if you rotate the T-shape. Our first task was to translate the T-shape into different positions on the same sized grid and investigate the relationship between the T-total and T-number. n = T-number t = T-total (By 'difference between' I mean the amount added or subtracted to get to the next number in the second column) n t Difference between 5n 5n - t Therefore 5n - 63 20 37 00 63 t 21 42 5 05 63 t 22 47 5 10 63 t 23 52 5 15 63 t 24 57 5 20 63 t So the equation for finding the T-total anywhere on a nine width grid if you only know the T-number is 5n - 63 = t. You can prove his by using algebra: n-19 n-18 n-17 n-9 n n + (n - 9) + (n - 18) + (n - 17) + (n - 19) = 5n - (9 + 18 +17 + 19) = 5n - 63 This is so because each time you move up a row on a

I am going to investigate the relationship between the T-Totals and T-numbers when the T-shape is translated in different sizes of grids
T-Totals I am going to investigate the relationship between the T-Totals and T-numbers when the T-shape is translated in different sizes of grids. A good way of showing translations is by using vectors. To give you an insight of how the grids look I have used 3 different grid sizes which I will be investigating further on. In each column of the grids we see that every time 9,8 or 7 is added to the number and it follows this sequence and the numbers on a row when added contain, (9 by 9 grid) 81,(8 by 8 grid) 64 or(7 by 7 grid), 49 numbers. row The T-shape drawn on grids will look like this This is called the T-Number, I will refer this as N When adding all the number together we will get the T-Total I will refers this as T. In the next table I have calculated the T and N which gave me the following results: T 37 42 47 52 N 20 21 22 23 We can see from this information that every time the T-Number goes up one the T-Total goes up 5 if we were to skip one place than we would have to add 10 instead of 5 as you see in the above the table it shows us 37 and when skipping one place you get 47 the same thing is done to 42 and skipping a place will give you 52. Which will give me the following pattern: T + 5 N + 1 ratio 1:5 Now we got this information so we can find the formula. I have found a formula which is 5N - 63 = T I have

I am going to investigate T-Shapes.
GCSE Maths Coursework I am going to investigate T-Shapes drawn on a 9 by 9 square as shown below: - 2 3 4 5 6 7 8 9 0 1 2 3 4 5 6 7 8 9 20 21 22 23 24 25 26 27 28 29 30 31 32 33 34 35 36 37 38 39 40 41 42 43 44 45 46 47 48 49 50 51 52 53 54 55 56 57 58 59 60 61 62 63 64 65 66 67 68 69 70 71 72 73 74 75 76 77 78 79 80 81 The total of the numbers inside the shape is the t-total. The bottom number in the t-shape is called the t-number. I have worked out a formula to work out the t-total from the t-number. I am using N as the T-Number and T as the T-Total. N-19 N-18 N-17 N-9 N = N-19+N-18+N-17+N-9 = T=5N-63 I have now worked out a formula, which will enable me to calculate the t-total form the t-number. Firstly I must test the formula on some results I have already worked out. T-Number T-Total Manually Using Formula 20 37 37 21 42 42 22 47 47 23 52 52 24 57 57 25 62 62 26 67 67 As you can see the formula works and can be used to calculate any result. The results increase by five each time, this is why the T-Number is multiplied by five. Sixty three is then taken away to get the T-Total. Now I have worked out a formula for a 9*9 square I am going to look for similar trends in 9*9 to 14*14 which will give me 5 results. 2 3 4 5 6 7 8 9 0 1 2

T totals - translations and rotations
2 3 4 5 6 7 8 9 0 1 2 3 4 5 6 7 8 9 20 21 22 23 24 25 26 27 28 29 30 31 32 33 34 35 36 37 38 39 40 41 42 43 44 45 46 47 48 49 50 51 52 53 54 55 56 57 58 59 60 61 62 63 64 65 66 67 68 69 70 71 72 73 74 75 76 78 79 80 81 82 T-totals coursework By Michael Ogolo My T number is 20 as you can see on my 9by9 grid and I will be representing this as N in my equation. My T total is 1+2+3+11+20= 37. The number in my T shape directly above the T number is 9 places back in the grid so it is N-9. The number directly above this number is also 9 places back in the grid so it is N-9-9= N-18. The two remaining numbers in the T shape are N-18+1 and N-18-1. Thus the T total is: N+ (N-9) + (N-18) + (N-18+1) + (N-18-1) = 5N-63 2 3 4 5 6 7 8 9 0 1 2 3 4 5 6 7 8 9 20 21 22 23 24 25 26 27 28 29 30 31 32 33 34 35 36 37 38 39 40 41 42 43 44 45 46 47 48 49 50 51 52 53 54 55 56 57 58 59 60 61 62 63 64 65 66 67 68 69 70 71 72 73 74 75 76 78 79 80 81 82 Rotated translation 90 degrees anti-clockwise My T number is 21 as you can see on my 9by9 grid and I will be representing this as N in my equation. My T total is 28+19+10+20+21=98. The number in my T shape directly above the T number is 1 place back in the grid so it is N-1. The number directly

specify
T-Shapes Coursework We have been asked to investigate the relationship between the T-total and the T-number for our T-shapes coursework. We have been given our first T-shape on a 9 by 9 grid. This T-shape is shown below: The total of the numbers inside the T-shape is 1 + 2 + 3 + 11 + 20 = 37 this is called the T-total. The T-number for this T-shape is 20. T-number I have now moved the shape over one square on the grid. The new total of the numbers inside the shape is 2 + 3 + 4 + 12 + 21 = 42. Looking at this I can see that 5 has been added to the T-total. This is because when moved over, each number increases by one, and because there are 5 squares in the T-shape, the number increases by 5. Knowing this I can now predict that if I move the T-shape over by another square, the new T-total will be 47. I have now moved the T-shape over by another square and the new T-total is 3 + 4 + 5 + 13 + 22 = 47. This is what I originally predicted. T-total of original T-shape. 37 T-total after first translation. 42 T-total after second translation. 47 I have recorded the results of the original T-shape total and the T-total after each translation in the table above. I have noticed that after each translation 5 has been added to the T-total. This is because when the T-shape is moved across once on the grid, one is added to each number, and because there are 5 numbers
I will be in investigating the relationship the between the t-total and the t-number. I will be using grids of different sizes to help me solve and find a formula.
The Investigation of T-Shapes Introduction I will be in investigating the relationship the between the t-total and the t-number. I will be using grids of different sizes to help me solve and find a formula. Investigation The total number of the numbers on the inside of the T-shape is called the T-total. The number at the bottom of the T-shape is the T-number. The centre column of the T-Shape is going up in 9's because of the table size. With the table set out like this a formula can be worked out to find any T-Total on this size grid. 7 18 19 9 T If you take the other numbers in the T-Shape away from the T-Number you get a T-Shape like this. T-17 T-18 T-19 T-9 T This is done in the working below:- T-total = T-19+T-18+T-17+T-9+T = 5T-63 Now to test this formula to see if it works For T-Total I will use the letter X For the T-Number I will use the letter T So X = 5T-63 T = 20 X = 5x20-63 = 100-63 = 37 Now I will do two more to check to see if it will work anywhere on the grid. T=43 X=5x43-63 24+25+26+34+43=152 X=215-63 X=152 T=49 X=5x49-63 30+31+32+40+49=182 X=245-63 X=182 I have tested the formula for three different T-numbers and the formula works for a 9 by 9 grid. The full formula for this size grid is: - X=5T-63 This time the centre column of the T-Shape is going up in
Modelling Motorway Toll Charging
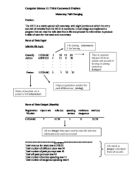
Computer Science 111 Third Coursework Problem Motorway Toll Charging Problem The M111 is a newly opened toll motorway, with eight junctions at which the entry and exit of vehicles from the M111 is monitored. I must design and implement a program that can read the tolls data from a file and process the information to produce a table of users for that week and a summary. Form of Data Input tollsinfo file input Gravelly L123ABC J 23 15 30 Ashton ABN1123 J 11 0 56 . . . . . . . . . . . . . . . . . . . . . . . . Fratton L123ABC L 1 12 31 Form of Data Output (Results) Registration trips in wk tolls due speeding violations total due Number serious dangerous _______________________________________________________________ L123ABC 7 11.76 1 0 31.76 ***********************Summary*********************** Total revenue for week was £1129.23 Total number of different users was 24 Total number of peak journeys was 45 Total off peak journeys was 65 Total number of serious speeding was 11 Total number of
How I can get started. I could start by by drawing different T-shapes and using 12 different grid-sizes. I could explore as many aspects of the task as possible, explaining why and how, and develop the task into new areas.
Ryan Chimene 11V Mathematics Coursework (T-Shapes). What does the task tell me? This task tells me that I could investigate a number of different number grids and discover a lot of surprising information by so doing. It also tells me about the t-number and T-total and how I can create or identify one. What does the task ask me? This task is asking me to predict and check for facts and to work on different size grids. I have also been asked to write down questions which might occur to me and probably help me to find out more about the task. I have to link words, tables, diagrams, graphs, calculations and algebra. Lastly, I have to show how patterns have been used and to test my conclusions by providing proof of my results using mathematical models and new results from work previously done, using clear reasoning to prove my results. How I can get started. I could start by by drawing different T-shapes and using 12 different grid-sizes. I could explore as many aspects of the task as possible, explaining why and how, and develop the task into new areas. Which connection is possible? The connection between the graphs and the tables of my results. I had to find-out the type of pattern which would show-up if I used the data I placed in my tables. Is there a result to help me? Yes, the tables which I constructed by collecting a number of t-numbers and then working out
Maths Grid Coursework
I will now investigate different size grids. An 11 by 11 1 2 3 n=24 2 13 14 23 24 25 T=n+ (n-11) + (n-23) + (n-22) + (n-21) T=5n-77 Now test this: 24 25 26 n=47 35 36 37 T=5n - 77 46 47 48 T= (5 x 47) - 77 T=158 Check 24+25+26+36+47 =158 So this formula does work. A 6x6 grid 1 2 3 n=14 7 8 9 3 14 15 T=0 + (n-6) + (n-12) + (n-13) + (n -11) T=5n-42 Now to test it. 8 9 10 n=21 4 15 16 20 21 22 T=5n -42 T=(5x21)-42 T=105-42 T=63 Check T=8+9+10+15+21 T=63 So the formula is correct. I will now compare the formulas for the different grid sizes. 11 x 11= 5n - 77= 11x7= 77 9 x 9= 5n - 63 = 9x7= 63 6 x 6= 5n - 42 = 6 x 7= 42 5n is consistent because the T shape is always the same size. (With the same amount of numbers in side the T shape) The numbers which are underlined are all divisible by 7. This means that if you know the grid size you can multiply it by 7 and it would give you the number that you would subtract from the Tnumber. From this we can make a general formula for any size grid and any Tnumber. g=grid size The General Formula is: T=5n-7g N.B This formula only applies to a T this way up: Formulae Formula Shape of 'T' )T=5n-3 T(in 9 by 9 grid) 2)T=5n-7g` T(in any size grid) From these formulae I will investigate whether you could find the Tnumber from them instead of the Ttotal. Formula Shape Of T