Statistics Mayfield High
Statistics Coursework - Mayfield High School Database This investigation is to analyze data in the Mayfield High School Database and come up with some hypothesis and to conclude whether there is reason to believe that they are true. I am going to investigate the data from Mayfield High is a database of information from the 1183 pupils at the school (when the database was compiled). Hypothesis: . Do Girls have a higher IQ than boys? It has often been said that girls do better at exams but does this mean that they have a higher IQ? 2. Is there a correlation between the IQ and KS2 results? Often, those that have a high IQ have high levels in their KS2 results. 3. Do those that watch more TV have a lesser IQ? Research has suggested that those who watch more TV have a lesser IQ but is this true at Mayfield? 4. Is it true that the girls are taller than boys? Research has said that while boys may be stronger and heavier, Females are taller in general. Any problem data will usually be removed. If there is no entry for the field, I will delete the entry. If there are any outliers, I will check whether it is 1.5 times greater than the Inter Quartile Range. If it is quite far away from the Lower Quartile or the Upper Quartile, I will discard the data but if it is not far away, I will decide on whether it should be omitted or not. Some abbreviations I will use: LQ = Lower

Mayfield High School Project
Mayfield High School Project Introduction Mayfield High School is a secondary school of 1183 pupils aged 11-16 years of age. There are 603 male pupils and 580 female pupils at this school. For my Data Handling Coursework, I will be investigating a line of enquiry from the pupils' data. Some of the options include the relationship between IQ and Key Stage 2 results, comparing hair colour and eye colour. However, I have chosen to investigate the relationship between height and weight. One of the main reasons being that this line of enquiry means that my data will be numerical, allowing me to produce a more detailed analysis rather than eye or hair colour where I would be quite limited as to what I can do. If I were to make an original prediction of my results, my hypothesis would be; "The taller the pupil, the heavier they will weigh." In this project I will consider the link between height and weight and will eventually be able to prove whether my original hypothesis is in fact correct. Other factors I am going to consider when performing this investigation, is the effect of age and gender in my results and I will make further hypothesize when I reach that stage in my project. Collecting Data I have originally decided to take a random sample of 30 girls and 30 boys; this will leave me with a total of 60 pupils. I have chosen to use this amount as I feel this will be an
Obtain information to make a report on family size and the structure of families of particular size (number of boys/girls).
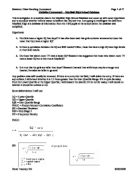
4th April 2001. Probability Models For Data. Coursework Title Obtain information to make a report on family size and the structure of families of particular size (number of boys/girls). To carry out this investigation I carried out a survey of 450 families. The survey was taken in my school by randomly selecting 450 individuals and asking them how many children their parents have. I did included half brothers/sisters, but decided not to include step brothers/sisters as I felt this may produce some anomalies to my investigation and also these people are not genetically related. I have found two separate statistics for the probability of male and female births in the Probability Models For Data textbook. One states that they are both equally likely and therefore there is a 0.5 chance of each birth being either male or female. The other statistic I found in the textbook stated that the probability of a male birth was more likely than a female birth, it states that the probability of a male birth is 0.513 and the probability of a female birth 0.487. These probabilities were calculated from a census taken in 1991. Once I had completed the survey I organised the data into tables of increasing family size. The data can de seen on the following pages. I decided that I would analyse the number of male births. I chose to analyse the data using the binomial model. I chose

During this coursework unit I will be using statistical knowledge to analyse my data of the adult illiteracy rate in various countries and grouped populations.
Nicholas Marshall 10A 13/4/02 During this coursework unit I will be using statistical knowledge to analyse my data. The Topic- The topic that I've chosen to do, and to compare, is the adult illiteracy rate in various countries and grouped populations (all people around the world who earn low income/ high income etc.) in 1990 and 1999 (the grouped populations are at the end of my results table). From my research I could ask: * What is the relationship between male and female illiteracy? * What is the relationship between male/female illiteracy in the two years provided? * How much the illiteracy rate changed over the nine years. Out of these questions I will make a hypothesis. I plan to use my data (which will be collected) to prove whether my hypothesis is right or wrong by doing mathematical calculations and graphs to get information. Hypothesis- In the same year (e.g. females in 1990 vs. males in 1990) the percentages of adult (people who are 15 and over) females' illiteracy rate in countries and grouped populations (low income, middle income, lower middle income, low and middle income, continents and high income) around the world is higher than the percentage of adult males' illiteracy rate in countries and grouped populations around the world. Data Collection- Plan- Since my hypothesis has a very large sample (it covers the entire world) it will be

From the data I have received I have chosen to conduct an investigation comparing height and weight because I feel there much relevance between ones and height and weight.
Mathematics Coursework In this investigation, I have been given data from Mayfield School. From the data I have received I have chosen to conduct an investigation comparing height and weight because I feel there much relevance between ones and height and weight. I have chosen to compare height and weight because I feel I will get clear results and therefore conduct a meaningful and knowledgeable investigation. I will be trying to determine whether ones height has any relevance to ones weight and then I will attempt to find out whether separating boys from girls will show different trends and in general have much difference from the group as a whole. I will first investigate heights and weight for year 7 and for year 11 and as an extension I will make comparisons and comment for both years. For my investigation I will need to start with a random sample of 50 students (25 girls, 25 boys) from year 7. I have data from a total of around 170 students, and the amount of boys and girls are roughly even, hence meaning there are about 85 boys and 85 girls. To get a completely unbiased sample of students I will be using random selection. I have figured out that because there are around 85 boys it will be sensible to choose every third boy in the list starting with the third boy down the list. Theoretically this will mean that around 10 students will not even be considered at

Data Handling Maths Coursework
MATHEMATICS GCSE COURSEWORK Data Handling Investigation Roshni Sharma Centre Number: Candidate Number: Contents INTRODUCTION Aims 3 Hypotheses 3 Variables 4 Sampling 4 Plan 6 Common Terms 6 Random Samples 7 DATA PROCESSING & INTERPRETING 1ST Hypothesis 12 2ND Hypothesis 16 3RD Hypothesis 20 4TH Hypothesis 22 EVALUATION Conclusion 27 Limitations 28 Introduction In this investigation, I am looking at a mixed, secondary school called Mayfield High School. I am going to be looking at the students in key stage three and key stage four. I do not have any knowledge about the details of this school, for instance, its location. Mayfield is a fictitious school but the data presented is based on a real school. I obtained the data about the school from an electronic database. This is a secondary source of information, as I have not obtained this data myself. If I was to have done the research and obtained the data for myself, I would have given questionnaires to all the pupils and asked them relevant questions in relation to what I want to study. The total number of students at the school is 1183. Aims: To investigate the way height and weight of boys and girls change with their age. I also intend to investigate the relationship between height
Is there a link between IQ and Key Stage 2 results?
GCSE Statistics Coursework Is there a link between IQ and Key Stage 2 results? Introduction: IQ 'has no impact' on exam success Psychologists say memory is the key to good GCSE results. I intend to investigate whether there are links between your Intelligence Quotient and your Key Stage 2 results. I intend to do this by looking at data from 12 to 16 year olds who attend Mayfield High school. Lines of Enquiry: My lines of Enquiry shall include: Links between IQ and KS2 results Links between gender and IQ Links between gender and KS2 results Links between age and KS2 results Hypothesis: I predict that Gender will have little effect on both IQ and KS2 results; this is because although females are more mature than boys at adolescence, both IQ and test results depend on the individual. I also predict that IQ will have a strong effect on KS2 results because someone with a higher IQ is able to learn and remember things better so consequently their KS2 results shall be higher than those with a lower IQ. I also predict that someone's KS2 results may be related to what year they took their KS2 exams as learning techniques may be improving as more research is being done in this area. For this reason I would predict that the older you are, the lower your KS2 results shall be. Data Collection: To investigate these links, I tested my questionnaire on a few people first to see

Maths Statistics Coursework - Mayfield School Data
Maths Statistics Coursework - Mayfield School Data Louise Bishop 5A Task Description and Specifying the problem and Plan. Specify and discuss the Hypotheses I will investigate the following statements. I was interested in how age would affect a number of factors and so I chose to investigate the age variable. I decided to investigate the following hypotheses: * How does age affect height? You get taller as you get older * How does age affect weight? You get heavier as you get older. * How does age affect IQ? You get more intelligent as you get older. I hope to be able to draw firm conclusions from these three hypotheses. I will also be interested to see the conclusions to the third hypotheses to see if you get more intelligent with age. As I thought about this, I realised that there is a subtle difference between IQ and exam results and so I decided to investigate an extra hypotheses. * How does IQ affect exam results? A high IQ guarantees good exam performance. I think this statement will be particularly interesting as I do not think that intelligence would necessarily suggest a good exam result. People with a very high IQ may well expect to get good exam results, but would this trend be consistent? My final hypothesis is to investigate the merits of a high or low IQ. * Does a high IQ suggest strength in a particular subject? People with a high IQ tend to be

mayfield high school handling data coursework
GCSE HANDLING DATA COURSEW0RK Faisal Iqbal 10rj CANDIDATE NUMBER-4067 Mrs Panesar Contents page Introduction In this statistical enquiry I will be investigating the relationship between heights and weights and also some more hypotheses, I will investigate this data using the Mayfield high school data this is data on students in all years in a fictitious school the data for the students contain there name, age,, height, weight, I.Q, however once I had got my data I had to delete the unnecessary columns because they were no use to me during this project. For me to prove my hypotheses I first of all would need to select a sample size which I feel will help me prove my hypotheses, once I have collected my data I will then go on to process them into a range of tables, graphs and charts I will do this because it will help me to notice any patterns in my data and also help me establish whether my data is correct. After the processing of my data I will then go on to analyse my data I will do this because it will help me find any clear patterns or relationships that will help me prove my hypothesis. Once I have done all that I will then go on to my evaluation on this part of the investigation I will evaluate on how I went on my project saying where I felt I done well in and also where I felt I could of done better in and finally I will say how I could make this project better

The correlation between the height and weight of pupils at Mayfield High.
Rosanna Marr For this project I have decided to look at the correlation between the height and weight of pupils at Mayfield High. We were given data about an imaginary high school, which showed the gender, date of birth, IQ, eye colour along of each pupil with other information. This table shows the amount of pupils in Mayfield High: Year Boys Girls Total 7 51 31 281 8 45 25 270 9 18 43 261 0 06 94 200 1 84 86 70 Total 604 579 183 On deciding what I was going to investigate it became clear that much of this information was unnecessary, so, on my database, provided from my school computer, shown on Excel, I deleted certain categories, but kept information on height, weight, surname, forename, gender, year group and age, which I felt might come in handy during my enquiry. To collect the data I needed, I simply transferred it from the provided statistics on Excel, to other worksheets, splitting the information into several different categories. My first category was a mixed sample, including both genders and all of the years. I used an equation; =INT(RAND()*(1183-1)+1) I used this in order to generate random whole numbers between 1 and 1183, giving me a completely unsystematic mix of pupils from Mayfield High. By typing it into a column in Excel and pressing enter, a number between 1 and 1183 will appear; by repeating this equation 50 times I