
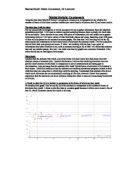
To analyse the distribution of the number of hours spent watching TV per week and IQ's for students in year's 7 and year's 9 and to see if there is a relationship between them.
Maths investigation 2002 MAYFIELD HIGH SCHOOL Aim: To analyse the distribution of the number of hours spent watching TV per week and IQ's for students in year's 7 and year's 9 and to see if there is a relationship between them. Hypothesis: ) I predict that the more hours spent watching TV per week, the lower the pupils IQ will be. This is for both year groups (year 7 and year 9). 2) The younger the person is, the more TV they will watch. Method: I chose 35 samples of both boys and girls from year 7 and year 9. I used random sampling by pressing the random button on my calculator, and taking the first two numbers to get my samples. As they were randomly chosen, I had to re-arrange them into numerical order for both IQ and number of hours spent watching TV per week. I then designed different tables and graphs in which I could display my results and comparisons. Sampling: I used random sampling to choose my 35 samples of girls and boys from year 7 and year 9. I had to make sure that the numbers I picked actually existed and that I had covered the range of pupils in the year group. This meant my samples had to range from the beginning of the alphabet to the end of it. I used my calculator to get my samples. My different graphs were as follows: * Cumulative Frequency Curves * Box Plots * Scatter graphs * Histograms * Mean, Mode, Standard Deviation * Inter Quartile

Discuss the role of genetics & cultural differences in the development of intelligence.
MORAL DEVELOPMENT DISCUSS THE ROLE OF GENETICS & CULTURAL DIFFERENCES IN THE DEVELOPMENT OF INTELLIGENCE. A study into IQ and genetics by Plomin et al. (1997) found from a longitudinal study of 245 children adopted (before the age of 1) that there was a correlation between the child and both sets of parents. Common sense suggests that as the child grew older they would become more like adoptive parents. However, this was not the case, instead the opposite happened in IQ, in adolescence there was no correlation with adoptive parents, the correlation wit biological parents remained. There was no difference adopted children and a control group who remained with biological parents. By adolescence both groups had come IQ correlation with biological parents. This study suggests that genetics have a strong influence on IQ. Bouchard & McGue (1981) carried out a study into the relationship between IQ and genetics by using a twin study. They reviewed 111 studies of twins and concluded that the mean correlation of intelligence in identical twins is 0.86, whereas for fraternal twins it is 0.6. A criticism of this study is that people who share genetic similarities tend to share environmental similarities, which makes it unclear whether it is genetics or the environmental that affects intelligence. 'Culture' refers to the rules, morals and methods of interaction that bind a group of

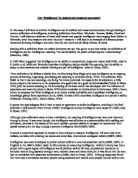
Business Report part 6 (graph1)
Graphs The graph shows that there are more females than males. This graph shows the amount of people who carry a mobile. Most people carry a mobile. This is a good sign as we know that people in that area are used to mobiles. This graph shows the model or brand people would like to buy if they were considering buying one. From my results I could clearly see that Nokia is a popular type of mobile. This graph shows the maximum amount people would spend on a mobile phone. Most people choose £100-£200. This is a good result because of course any customer would want a good mobile and the staff can provide them with a mobile to their satisfaction because most mobiles are available in this
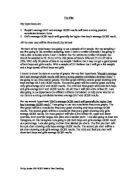
Using the data from Mayfield School I am going to construct an investigation to see whether the number of hours of television a student watches per week directly influences their IQ and exam results.
Maths Statistic Coursework Using the data from Mayfield School I am going to construct an investigation to see whether the number of hours of television a student watches per week directly influences their IQ and exam results. The data that I will be using For my coursework investigation it will be necessary for me to gather information from the Mayfield spreadsheet provided. I will need to conduct random sampling because there is simply too much data for me to handle. I have decided to use every fifth piece of information; this will enable me to gather information fairly so I will get a variety of data from both classes and sexes. Sampling every fifth piece of data will also permit me to construct accurate graphs. The data that I will be using will be the IQ, exam results and information on how many hours of television the students watch. I will be using data derived from both year groups and sexes. If when I am working with the data I see a piece of information that looks incorrect to me, such as someone having an IQ of 200 I will delete that students data and use another person, this way I can make sure that my graphs are a accurate illustration if the effect that IQ has on intelligence for example. Hypothesis. I predict that the students who watch a lot of television will have lower IQ's than those who find alternate means of entertainment. I predict this because I

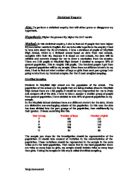
Using the data from Mayfield High School, I am going to be investigating the relationship between IQ level and Key Stage 2 results.
Using the data from Mayfield High School, I am going to be investigating the relationship between IQ level and Key Stage 2 results. I would expect to find that people with higher IQ will have higher KS2 results. I am going to take a random stratified sample of 60 students; this will enable me to take a proportional amount of pupils from each year group. To do this calculation I needed to find the number of people in each year group then divide it by the total number of people in the school, after you have done this you need to multiply it by the size of your stratified sample. So my calculation for the number of students I need from year 7 would be: 282/1183*60=14.3... as this is a decimal answer I will have to round it off to the nearest whole number. As mine is 14.3 I will round it own to 14. Year Calculation Number of Pupils 7 (282/1183) x 60 4 8 (270/1183) x 60 4 9 (261/1183) x 60 3 0 (200/1183) x 60 0 1 (170/1183) x 60 9 60 This table shows me how many pupils I need from each year group. To start off with I gave each student a number from 1 - 1183, I then sorted the data into year groups and then I generated a random number between 1 -1183 using my calculator. In order to see if there is any relationship between Key Stage 2 results and IQ I am going to draw scatter diagrams. I will draw a scatter diagram for the entire school as well as one for each

HYPOTHESIS Blonde girls are more intelligent than non blonde girls. Blonde girls that have a higher IQ watch comparatively less television. This will not be the case however for non blondes as there will be little or no correlation.
GCSE Statistics Project DATABASE I am going to use the Mayfield High School Database which is secondary data for my investigation. HYPOTHESIS * Blonde girls are more intelligent than non blonde girls. * Blonde girls that have a higher IQ watch comparatively less television. This will not be the case however for non blondes as there will be little or no correlation. * The IQs for non blonde girls and blonde girls are normally distributed. PLAN FOR DATA COLLECTION I shall collect data the relevant data to my hypothesis first separating by Gender and then gathering relevant information on IQ, Hair Colour and Number of Hours of Television viewed. I shall use a sample size of 50 blonde girls and 50 non blonde girls as I feel that a sample size of 100 offers a good proportion to analyse being that there are roughly 1,182 entrants in the database. Also 100 is a good round even number which will make calculations of the data easier. I will use stratified sampling so that a there is not a disproportionate number of any particular group and so that the different year groups are properly represented. I shall then begin on my first hypothesis - Blonde girls are more intelligent than non blonde girls. To investigate this hypothesis I need to present and analyse the two sets of data using various graphs and calculations. As I am dealing with 2 ranges of values which
My hypotheses are: -1. People's average SAT and average GCSE results will have a strong positive correlation between them.2. Girl's average GCSE result will generally be higher than boy's average GCSE result.
The Plan My hypotheses are: - . People's average SAT and average GCSE results will have a strong positive correlation between them. 2. Girl's average GCSE result will generally be higher than boy's average GCSE result. All the data used will be from Steel City School For both of my hypotheses I am going to use a sample of 55 people. For my sampling I am first going to use stratified sampling, when I have a number of people I am going to role a dice to decide where I start. I believe that the minimum number of people that should be sampled is 50. 50 out of the 166 pieces of data is 30% and 55 out of 166 is 33%. With only 30 pieces of data in my sample I believe that I may not get a good spread of both boys and girls results. With a sample of 55 I believe that I will get a fair sample and a large spread of both boys and girls. I intend to show the data on a series of graphs. For my first hypothesis "People's average SAT and average GCSE results will have a strong positive correlation between them." I am going to use three scatter graphs. The first graph will be a scatter graph showing only boys average SAT and GCSE results. The second graph will be a scatter graph showing only girls average SAT and GCSE results. The third and final graph will show both boys and girls average SAT and GCSE results. On all three I will plot a line of best fit. I am also going to use
Perform a statistical enquiry that will either prove or disapprove my hypothesis.
Statistical Enquiry Aim: To perform a statistical enquiry that will either prove or disapprove my hypothesis. Hypothesis: Higher the persons IQ, higher the SAT results Method: In this statistical enquiry, I aim to find out if people that have higher IQ have better results in English. For me to be able to perform the enquiry I had to have data about the IQ of students. I have a database of pupils of Mayfield High School, which is a fictional school based on data from real schools, complete with their IQ. Because it is based on real schools, the data will be reliable and accurate enough for me to draw a conclusion from the enquiry. There are 1183 pupils at Mayfield High School- I decided to compare 10% of general population. This is roughly 100 pupils. The hundred people I get from the general population will be my sample. Since there are different strata's in my data, I had to find out what number of boys or girls from each year group I am going to take from my hundred samples. For that I used stratified sampling. Stratified Sampling Students in Mayfield high school are the population of the school. The population of the school are the pupils that are being studied. Since in Mayfield High School there are 1183 pupils, it would be very impractical for me to study and compare all of the data. I have to take a sample- a smaller group of people from general population. I

The aim of my investigation is to investigate the factors IQ and KeyStage 2 Results for girls and boys of a fictitious secondary school. I am then going to see how the results differ between the sexes.
INTRODUCTION The aim of my investigation is to investigate the factors IQ and KeyStage 2 Results for girls and boys of a fictitious secondary school. I am then going to see how the results differ between the sexes. I am going to investigate the following statements, "Boys will have a higher modal and median IQ scores than girls", "Boys are smarter than girls but girls will achieve higher grades because they work harder," and "KeyStage 2 Results are comparative to IQ." I will start by collecting the relevant information from www.edexcel.org.uk I know this information is reliable because the website was suggested to us by Mrs Allen and she is a reliable source. The next step is to collect a sample size. I have chosen to use stratified sampling and to take a percentage of 10% of both girls and boys from each year. So for example, if there are 200 pupils in year nine, 90 girls and 110 boys, I will randomly select 9 girls and 11 boys from year nine. METHOD I will ensure it is a fair sample by selecting the data using the random function on Microsoft(c) Excel. See appendix 1.1 for my samples. If I am to come across any obvious anomalous results I shall exclude such datum from any further investigation to make my analysis as accurate and fair as possible. To see if my statements are correct I will first have to plot IQ and KeyStage 3 Results in separate tally and frequency
A typical intelligence test asks a variety of questions, many of which are of the type one learns to answer in school
Can "intelligence" be defined and measured accurately? In this essay I will look at whether intelligence can be defined and measured accurately through looking at various definitions of intelligence; including definitions from Binet, Wechsler, Terman, Hebbs, Cattel and Vernon. I will discuss a selection of more well known and popular intelligence tests ranging from Galton to Wechsler, what they measure and what they don't measure. I will look at an example of a famous person renowned for being intelligent and what there IQ test result would likely of been, if tested. Starting with a definition from the oxford dictionary we can then go on to see how varied the definitions of intelligence can be. Intelligence, meaning "the mental ability the power of learning and understanding" (Hawkins, 1988). In 1905 Binet suggested that intelligence is the ability to comprehend, judge and reason well (1905, cited in P, Smith et al, 2003) and Wechsler describes intelligence along a similar line agreeing that the ability to adapt to circumstances and rational thinking are part of intelligence (cited in Gross, 1992). Three definitions that follow a similar line, the first being from Piaget who sees intelligence as an ongoing process of learning, organising, developing and adapting to situations (Pyle, 1979). The definition from Hebb is that it has two meanings, one being "an innate