Rolling and annealing of copper block.
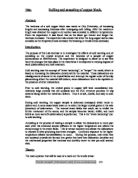
Title: Rolling and annealing of copper block. Abstract: The hardness of a soft copper block was tested at City University, of increasing lengths and decreasing thickness after undergoing cold rolling. After the maximum length was obtained the copper a cut section was annealed to different temperatures. From the experiment it was found that as the block got thinner and longer the hardness increased. The experiment also shows that when the long copper section was annealed as the temperature was increased the breaking or tensile stress decreased. Introduction: The purpose of this Lab exercise is to investigate the effects of cold working and of annealing on the crystal structure and the hardness of a sample of copper (dimensioned at 50x25x5mm). The experiment is designed to allow us to see first hand the changes that take place in the material as it is subjected to varying degrees of work (deformation) and heat treatment. Cold working uses the concept of "strain hardening", to "temper" the metal, which is based on increasing the dislocation density within the material. These dislocations are misalignments of atoms in the crystal lattice and interrupt the regular order of the slip planes along which the material will deform, since dislocations tend to be repulsive in the presence of other dislocations. Prior to cold working, the crystal grains in copper will have
The factors that affect used car prices.
The factors that affect used car prices Planning In this experiment we are going to be collecting data in such a way so that it can show us which factors affect used car prices the most and also the least. To give us a vague idea of which were most popular amongst the general public each class member did a survey on every member of their household to see which factors of a car affect them most when purchasing such a vehicle. The results of which are shown below. Owners Age Colour Price Make MPG Air conditioning Tax MOT 5 29 3 3 22 9 1 6 7 3 2 5 4 =8 =8 As you can see from the table of results the most popular factor was age, however I believe that some of the data could be bias as the people giving the data may have been in a rush at the time or not have put much effort in. In this experiment I am going to try and use as many varying data collection methods to try and get the best of the data that I am going to use. Hypothesis 1 My first hypothesis is that the higher the first hand price is the higher the second hand price will be, I have recognised that this is quite an obvious hypothesis, however looking at this will be able to show us the anomalies and why they are anomalous and with this data we can see how we can improve our data collection. I am going to first use a scatter graph of new price against old price. I will use all data given to

My aim is to investigate if the distance of an object from a light source affects the length of the objects shadow.
Sc1 Coursework - Shadows PLAN (P) Aim My aim is to investigate if the distance of an object from a light source affects the length of the objects shadow. Background Scientific Information A shadow is what is formed when some rays of light continue to travel in straight lines while other rays are stopped by an opaque object. Shadow due to a small source of light Shadow due to a large source of light There are other and practical uses of shadows as well though, a sundial can be created by shadows using the height and position of the sun to created by shadows using the height and position of the sun to create a shadow which tells someone what the time is. These were used before clocks were invented. The height and position of the light source affect the size of a shadow. E.g. how close it is to the object. Prediction I think that an ecliptical shadow will be formed during this experiment because we are using a solid and opaque object to test with which is a glue stick. I think that when the position of the light source is further away from the object, the shadow will get longer this is because more rays are directly hitting the largest face of the object therefore it blocking out more light creating a longer shadow. I think that the line graph would look similar to this: Apparatus 50 W bulb Retort stand Metre stick Object for creating a shadow (glue stick)
Used Car PricesCourse Work Some of the factors which affect the price of a used car Age, Mileage, MPG, Colour, Engine Size
Used Car Prices Course Work Some of the factors which affect the price of a used car Age, Mileage, MPG, Colour, Engine Size, Fuel, Service History, Number of previous owners etc. I am going to concentrate on the following areas:- . Make - The manufacturers of the car e.g. ford, Mercedes etc. I think this affects the price of a used car because the price of the car when it is second hand depends on the popularity of that car, or whether the car is rare or not. For example I would expect a Bentley TurboR to go for more than a Ford Mondeo. 2. Age - I would expect older cars to go for less than newer ones because the older the car the less life it had left in it. 3. Mileage - I would expect a car with a lot of miles on it to be worn down a lot more than a newer one. Therefore I would expect it to go for a lot less than one with fewer miles on it. 4. Engine Size - I think that cars with a bigger engine have a tendency to be more appealing than cars with small engines. For example a 2.3 litre Volkswagen golf would go for more than a 1.6 litre Volkswagen golf 5. Colour - Sportier cars have a tendency to be painted fiery red or very intense bright yellow and they tend to appeal to younger boy racers. These tend to have very high insurance groups
Are High Imagery Words Easier To Retrieve From The Short Term Memory Than Abstract Words?
Are High Imagery Words Easier To Retrieve From The Short Term Memory Than Abstract Words? Abstract The aim of this experiment was to establish whether concrete or abstract words have an effect on recall. The one tailed hypothesis was "High imagery words facilitates recall in both the long-term and short-term memory. An independent measures design was used. One control group was exposed to a list of written concrete words. The other control group was exposed to a written list of abstract words. Both groups were allowed a sixty second exposure time and then immediately asked to free recall as many words as they could. The results showed a significant difference in the recall of the concrete words compared to the abstract words. The mean difference of group 1 minus group 2 was 2.90. The confidence interval of this difference was 95%. In conclusion, it is expected that concrete words will facilitate a higher recall than abstract words. Introduction Alternative Hypothesis - High imagery words facilitates recall from both the short-term memory and long-term memory Null -Hypothesis - Any difference in the recall of high imagery words and abstract words from the short-term memory and long-term memory is due to chance. Atkinson and Shiffrin (1968) proposed a dual-processing model, sometimes referred to as the multi-store model, which focuses on information processing. Data enters

Data Handling Coursework
Data Handling Coursework Maths Aim: To find out what factors affect the car prices and show how these factors affect it. Introduction: In this investigation I aim to find out the main factors which affect the price of a car. I also aim to find out if there is only one factor or a combination of factors affecting the price of the cars. Firstly I will decide which method I am going to use and which line of enquiry would provide me with the best results. I will include in my investigation all of my explanations, details, tests and theories. I will be using 39 cars either five or six from each make, depending on the availability of the cars for each make. To show my results clearly and make them easy to understand I will be recording my data in tables and expressing the results in various scatter graphs, box and whisker diagrams and cumulative frequency diagrams. The reason for which I am expressing my results in a series of ways is because I will then be able to interpret them easier and so draw conclusions. Hypothesis: As the age of the car increases the percentage depreciation in the price will also increase, meaning that the price of the car will decrease. The factors that play a major role in the pricing of the car are percentage deprecation, age, status of the car e.g. if it is new or second hand, the engine size, the mileage and finally the make. My first table will

Show that certain aspects of cars can determine the price of a second hand car.
Introduction In this investigation, I am going to show that certain aspects of cars can determine the price of a second hand car. In this investigation, I have made the following hypotheses: * The price of a new car will decrease the most in the first few years * There will be a positive correlation between the depreciation and the age * The make will influence the price of the second hand car * There will be a positive correlation between the engine size and the price of the second hand car * There will be a negative correlation between the mileage and the price of the second hand car * The colour will not influence the price of the second hand car * The fuel type will not influence the price of the second hand car The main variables in this investigation that could make a difference on my investigation are the following: * Make * Second hand price * Age * Engine size * Mileage To do this investigation properly, I will need to prove my hypotheses. This will be done by me collecting the data from the database that was issued to us at the beginning of this investigation. I have also looked at sources from websites and car magazines regarding the prices of second hand cars. Second hand car dealers, newspapers and the television also are very useful sources of information. These sources will be very useful as for example the car dealers, they would have a lot of
GCSE statistics coursework
GCSE statistics coursework In this coursework I am going to investigate the affect that age has on the car. I am going to look at price, engine size, mileage, and age of the car. By the end of the coursework I am aiming to have a set of results about how the cars are affected by the age, price and mileage. My prediction should show that * As the car increases its price will decrease * The higher the mileage the price will decrease. Plan I am going to be collecting a sample of 100 cars. I will find mean, median, mode and range for some certain makes of cars, from the data I have been given. I will then represent my data by the following diagrams * Bar charts * Tally charts * Pie charts * Standard deviation (mean and mean deviation) * Scatter diagrams. The reason why I am doing so many diagrams is to give a clear understanding and also to give the reader a pictorial view about what is happening, and also I must say to get more accurate results. The diagrams would maintain a clear understanding and show what is happening to the cars and what people prefer according to their engine size. After each of the diagram I would explain how I did the diagram and what people prefer and why. I would compare the mean, median and mode to support my hypothesis. At the end of the coursework I would be doing a conclusion explaining what has happened and why. I am going to
Analyse how student's marks in a maths test react with or without music being played.
Maths Coursework (Music and work) Introduction This investigation is to analyse how student's marks in a maths test react with or without music being played. Hypothesis My hypothesis is: . For my hypotheses I think when music is played the students will perform badly but when music is not played pupils will perform better. I have now chosen my hypothesis. I have chosen these because I think these are relevant to the test when music is played or is not. Depending on the students interest in music the hypothesis might differ so if a student likes the music being played then they might perform better. If the student dislikes the music being played then they might perform not so well or worse. Action Plan Music will be played while students are taking the tests, the tests will be mental arithmetic. The tests will be conducted in 8 different AS maths groups. There are 2 statistics groups 2 mechanics groups 2 decision groups and 2 further maths groups. 1 of the groups from each different maths group will take the test with music played and the other will do the test without. This no means we will get a fair result from each of the two groups. The investigation will be made fair by having the same conditions in each room. The same track will played for all groups. Volume will be recorded and made the same in each groups room. We have come to a decision to choose a
Mathematics Handling Data Coursework: How well can you estimate length?
Mathematics Handling Data Coursework: How well can you estimate length? Introduction A school teacher asks two sets of students to estimate the length, in metres and to two decimal places, of a 1.58 metre long stick, held up horizontally in front of them; this is to prevent pupils from comparing the stick to the teacher's height. 178 Year Eleven pupils and 173 Year Seven pupils are asked. Hypothesis I believe that the Year Eleven pupils will be more accurate in their estimation than those in Year Seven. This is because they are older, more knowledgeable at Mathematics and have also been estimating lengths for a longer amount of time than Year Sevens. My Plan As there are over 170 pupils in each year, I will only be using a sample of fifty pupils from each year. I will randomly select these fifty pupils, using a certain method. I will then group my fifty data values into a grouped frequency table. This is because fifty is still a large number of lengths to be dealing with when carrying out certain calculations. Using my random data values, first I will calculate the mean. The mean is a type of average, which represents the pupils' accuracy at estimation. As I believe that Year Eleven's estimations will be more accurate than the Year Seven's, I therefore predict Year Eleven's mean value to be close to 1.58m. Next I will calculate the standard deviation of the two data