Investigating the statistical relationship between IQ levels and Maths KS2 results.
Edexcel 2003 Dispatch 1
Maths Investigation
Roman Gaufman
Mathematic GCSE
Mayfield High School
Can No: 6056
Introduction
In this investigation I will choose a hypotheses to investigate and use a variety of statistical methods to investigate whether it is correct and prove the fact that it is correct or incorrect. I will make a smaller sample of the database and arrange it by genders and year groups. I will make graphs, comment on them and use a variety of statistical method.
Hypotheses
My hypothesis is to prove that higher Maths KS2 results often affect the IQ levels and make a close relationship being the higher the Maths KS2 result, the higher the IQ level. I will also investigate gender differences and hope to prove that the male gender does generally better at maths then the female gender. I will then expand my investigation to investigate other subjects and their relationship to the IQ.
Deciding on sample size
I have decided to take a sample of 180 pupils from the school because it is a nice dividable number that will fit nicely into a pie chart and it is great enough to give relatively accurate results. However this sample isn't big enough to hold 100% accurate results and therefore the conclusion of the investigation should be considered as a respectable result, but further investigation should take place for a deeper more accurate analysis.
Bellow, I have made a table of the numbers of students in each class divided into genders and given in both real figures and 3 different percentages to investigate how large should the sample from each year group a gender should be.
Boys
Girls
Year
No
% 1
% 2
% 3
No
% 1
% 2
% 3
7
51
54%
25%
3%
31
46%
23%
1%
8
45
54%
24%
2%
25
46%
22%
1%
9
18
45%
9%
0%
43
55%
24%
2%
0
06
53%
8%
9%
94
47%
6%
8%
1
84
49%
4%
7%
86
51%
5%
7%
Av:
21
51%
N/A
N/A
16
49%
N/A
N/A
Total:
604
N/A
00%
51%
579
N/A
00%
49%
* table 1
Table Key:
% 1 investigated the Percentage of boys and girls in each year group
% 2 investigates the Percentage of boys or girls out of total boys or girls
% 3 investigates the Percentage of boys and girls out of the total amount of students.
Table Calculations:
%1 was calculated by adding the numbers of boys and girls in each year group and working out the percentage by multiplying 100 by the amount of boys or girls and dividing by the total amount of boys and girls in year group. E.G:
Y7 boys + girls = 151 + 131
= 282
100 x 151
282
% 2 was calculated by adding up all the boys or girls from all year groups and working out the percentage by multiplying 100 by the amount of boys or girls and dividing by total amount of boys or girls. E.G:
Boys = 151 + 145 + 118 + 106 + 84
= 604
100 x 151
604
% 3 was calculated by adding up all the boys and girls from all year groups and working out the percentage by multiplying 100 by the amount of boys or girls in each year group and dividing by total amount of boys and girls. E.G:
Boys + Girls = 151 + 145 + 118 + 106 + 84 + 131 + 125 + 143 + 94 + 86
= 1183
100 x 151
1183
The averages were calculated by dividing the sum by the number of year groups. E.G:
Boys = 151 + 145 + 118 + 106 + 84
= 604
Average = 604
5
Analysing the results in table 1 we see that from a sample of 180, to make a fair test, we will need 49% girls and 51% boys which makes: 88 girls and 92 boys. Further more, we will need to get a fair sample from each year group, so I will use the % 2 in table 1 to decide on how many people will be taken from each year group. I have highlighted in grey the values used to calculate the samples, and have made a table to show what sample will be taken.
Year
Girls
Boys
7
23%
20
25%
23
8
22%
9
24%
22
9
24%
21
9%
7
0
6%
4
8%
7
1
5%
4
4%
3
* table 2
I used the same method for calculating the sample size used for calculations in table 2 apart from 100% being 88 for the girls and 100% being 92 for the boys.
Now that we have decided on the sample size used for each year group and each gender, it is now time to decide on the random method to choose each person for the sample size.
Random Method
I have investigated many random methods and found a random number generator to be the best bet. I have created a list of some of the random methods I have used prior to deciding on the usage of a random number generator.
• One method was do +10 or +5 starting from the number that will ensure that ...
This is a preview of the whole essay
Now that we have decided on the sample size used for each year group and each gender, it is now time to decide on the random method to choose each person for the sample size.
Random Method
I have investigated many random methods and found a random number generator to be the best bet. I have created a list of some of the random methods I have used prior to deciding on the usage of a random number generator.
• One method was do +10 or +5 starting from the number that will ensure that there will enough results for my sample. Talking to friends, this method was a popular bet, but I felt like even though it will produce random enough results, it may also produce similar sample as my peers and that was a bit of a let down.
• Another method was to ask people to say a number in random that is also not a bad method that would've produces accurate enough results, but will suffer from more popular numbers like 7 and 2 to be used more then others that will make the sample not random enough.
• Using a dice to is yet another method that can be used but has a drawback of generating only a number between 1-6 that can produce a random enough result, but I feel more confident in using a random number generator to generate a truly random sample.
• A less popular method is throwing a 5p coin and counting +5 if it lands on heads and + 10 if it lands on tails. This is not a bad method, but will not cover a great enough range, so for instance the people with names from P to Z will not will sometimes not be used at all making the sample not random enough.
• And another less popular method is just pointing at the database while wearing a blind fold to generate a random sample. This method is quite a good way to generate a random sample and may work almost as well as a random number generator, but is probably too time consuming and requires a lot of nerves.
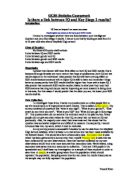
Based on the information above, I have decided to use a random number generator. I have searched the web and found that the most typical fastest high quality random number generator is located directly in the default shell of my operating system: Linux. In either bash or ssh shells a simple random number script looks something like:
echo $((($RANDOM % 100) + 500))
The echo command is a command used to write arguments to the standard output, so in this case all it does it prints the configured output which means start from 500 and create a random number that is maximum of +100 deviance from 500. However to further extend on this command I researched repeating the output and have made a new command that will help me generate a set number of outputs at the same time, in this case 10:
for ((i = 0; $i < 10; i++)); do echo $((($RANDOM % 100) + 500)); done
The 'for' command generates a list of set amount of items based on the set configurations of ((i = #; $i </>/= #; i+-)); and the list that I needed to print was of course echo $((($RANDOM % 100) + 500)) so in fact the 'for' command acted as a repeating command to display a list of 10 randomly generated numbers between 500 and 600. The body of the command was written from basic C and C++ knowledge and isn't really related to the commands themselves but rather to the main concept of Linux making each commands compatible with C and C++ code.
This random number generator is of a respectable quality and is more then enough for this project, however is a much larger sample is taken a better quality random number generator may be recommended and there are many dedicated projects to generating high quality random numbers that can be found on the net.
Now that we have the method that will be used to generate the 180 sample. It is time to put it to the test.
Random Number Generation
As discussed in the Random Method section of my investigation, a random number generator will be used. I have created the following table:
Girls
Boys
Y
No in Db
Cmd to Sample
Spl
No in Db
Cmd to Sample
Spl
7
52 - 282
echo $((($RANDOM % 131) + 152))
20
- 151
echo $((($RANDOM % 151) + 1))
23
8
428 - 552
echo $((($RANDOM % 125) + 428))
9
283 - 427
echo $((($RANDOM % 145) + 283))
22
9
671 - 813
echo $((($RANDOM % 143) + 671))
21
553 - 670
echo $((($RANDOM % 118) + 553))
7
0
920 - 1013
echo $((($RANDOM % 94) + 920))
4
814 - 919
echo $((($RANDOM % 106) + 814))
7
1
098 - 1183
echo $((($RANDOM % 86) + 1098))
4
014 - 1097
echo $((($RANDOM % 84) + 1014))
3
* table 3
Table Key: No in Db = Numbers as they appear in Database
Cmd to Sample = Command to query Sample
Spl = Number of samples to take
Using the commands in the table above I have made a table that I sorted by number and in the unlikely event of a repeated number, I did + 1 where possible and if + 1 wasn't possible because it makes the random figure go over the Numbers as appears in Database then I subtracted one. After running each command and noting all the samples for each year group and gender, I have compiled the following table that will be used to get my stratified sample from the database.
The sample that will be taken from the database is as follows:
* table 4
Now that I know what to sample it is time for some extensive copy pasting from the database to create the new summarized database with a sample size of 180.
I will begin by making smaller separate database for boys and girl where non relevant data won't be present like for instance: Surname, Forename and Average TV as those coulombs do not posses any useful info to use during the investigation. Average TV may be a factor in lower Key Stage 2 results, but it will not be focused on in this investigation.
I will also further divide the database to investigate specific connection between each subject, IQ , gender and will even try to investigate if the writing hand has any effect on the results that will be an easy test to make although I do not expect to see any connection.
Investigating Maths KS2 vs IQ
BOYS
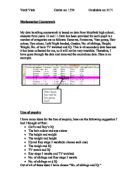
I have made yet another scaled down database with only the values of N, IQ and Ma so I can investigate if there is a clear connection between Maths KS2 and IQ. I have made the following X,Y axes scatter diagram with a generated linear regression line which is a a mathematical method where an empirical function is derived from a set of experimental data. Although the function itself is empirical, it is based on a theory that is my hypotheses.
The graph itself shows quite a weak connection of KS2 Maths results to IQ although there is a clear connection that on average, the IQ of a person depends on on his Key Stage 2 result.
One important factor to consider is when the IQ test was taken in relation to the KS2 exam date. Also, it is important that regardless of year group, the IQ tests should've been taken at about the same time, and from some general investigation mainly derived from looking at the database, we indeed see that the IQ tests were probably taken at the same time regardless of year group because the IQ results are the same between each year group and we don't see a distinction that older year groups posses a higher IQ. What isn't clear however is when the tests were taken and if they were taken a reasonable period after the KS2 Maths tests, then that might be a key explanation for the less then predicted results.
Bellow I have created a table to show that my hypotheses was still correct and you can see that IQ is related to KS2 results in maths although the table suggests a weak connection:
IQ:
L6
L5
L4l
L3
L2
Max
26
24
21
01
78
Min
14
90
93
72
68
Range
2
34
28
29
0
Mean
19
07.2
01.59
91.18
73
Median
17
06
01
90
73
UQ
26
10
03
97
78
LQ
14
05
00
85
68
IQ range
2
5
3
2
0
* table 5
To summarize table 5, we see that apart from 1 highlighted exception, the methods I used to to demonstrate the results of the table show that there is a clear connection between IQ and KS2 result therefore proving my hypotheses correct.
Calculations:
Most calculations needed to take place were already mentioned before. Upper Quartile and Lower Quartile were calculated by taking the number of results for a particular level and dividing by 4 to get Lower Quartile and then multiplied by 3 to get Upper Quartile and Interquarlite Range was calculated by subtracting the Upper Quartile from lower quartile
GIRLS
I have made an identical graph for the girls as I did for the boys, to once again
investigate relationship between IQ and Maths KS2 results. of a relationship. We can see a stronger connection for the girls however we can also see 2 exceptions that really pull the linear regression line down and make relationship much less obvious. Therefore, I have decided to generate a logarithm regression line that shows a much stronger connection because of a different method of generation that investigates the grow of IQ to generate a curve rather then a line.
I have decided to make the same table as I made for the boys, for the girls to investigate the relationships for the girls in order to draw same conclusions and to prove my hypotheses.
IQ:
L6
L5
L4l
L3
Max
30
32
16
02
Min
08
02
1
78
Range
22
30
05
24
Mean
21
11
97
92
Median
26
10
01
92
UQ
30
16
05
98
LQ
08
06
98
85
IQ range
22
0
7
3
* table 6
As I have predicted, we see that generally my hypotheses is correct and from looking at the results, we can draw the same conclusion for boys and girls. There is however 1 strange result for the girls. Apparently one of the girls got an IQ of 11 which is hard to believe considering the IQ of an 'idiot', considering 'idiot' as a medical term is 30. And this person isn't physically capable of tasks like reading a writing. So either the quality of results quite poor, or the person just did not bother answering the questions properly, this result is definitely an anomaly.
Investigating Gender Differences
We also see many differences to the boys. Firstly we see that the girls did better then the boys in KS2 Maths that contradicts my hypotheses, however we will investigate weather the impression the above table creates is true by drawing a frequency table to investigate the numbers and %s of girls and boys that got each level. This will not only compare the results of the boys and girls for the 2 subjects, but will also give us a % probability of what level each boy and girl is likely to get.
Level 2
Level 3
Level 4
Level 5
Level 6
Boys
2
2%
8
20%
39
42%
30
33%
3
3%
Girls
N/A
0%
20
23%
36
41%
29
33%
3
3%
* table 7
Looking at the table above percentage wise. We can see that boys and girls did almost equally well apart from a few exceptions like girls didn't get any Level 2 results and boys got less Level 3s and Level4s then the girls. Next I decided to compare IQ levels of both genders by creating yet another frequency table. After creating next frequency table, I will do some calculations to get an average of the boy's and girls IQ to compare them more effectively in an attempt to prove my hypotheses.
0 - 75
76 - 85
86 - 95
96 - 105
06 - 115
16 +
Boys
2
2%
3
3%
1
2%
46
51%
25
28%
4
4%
Girls
2
2%
5
6%
1
3%
38
43%
21
24%
1
2%
* table 8
Overall we see that the girls have a higher IQ overall yet roughly the same results as the boys. Now I would like to use table 6 and 7 and investigate them as probability tables. I have decided to sketch pie charts to demonstrate the probability of the boys and girls getting a certain maths result or IQ.
First I decided to investigate the probability that the boys a girls will get a certain result in Maths for KS2, and compiled the following 2 pie charts:
As we can see from the 2 pie charts on the previous page. There is indeed a similarity in the results of the two genders (apart from the Level 2 exceptions for the boys), and we can see that the 2 genders are equally intelligent and have equally high results.
Then I decided to make 2 more pie charts this time investigating probability of boys and girls getting a certain IQ.
As we can see the IQ difference are also not great, but there is a more distinct difference. We see that the boys stick to certain averages and there is a greater probability that the boys will be of average intelligence and IQ. When it comes to the girls, they tent to be on average either more intelligent or more stupid. So we see a larger red area that demonstrates great intelligence yet more blue, purple and yellow that demonstrate lower intellect. But on average, I would say the boys and girls have generally same KS2 Maths results and IQ. I have made a table of some more calculations to prove this fact:
IQ
Boys
Girls
Average Mean
01
01
Average Median
02
03
MATHS
Average Mean
4.15
4.17
Average Median
4
4
* table 9
As we can see, indeed the IQ and Maths KS2 results are very similar between the two genders. As a last investigation in this section I have decided to make a cumulative frequency table for the boy's and girl's IQ results in order to show everything I have proved earlier in cumulative frequency polygon.
* table 10
*NOTE* - 91 boys recorded because 1 of the IQ test results was missing.
I have created the following 2 similar cumulative frequency polygons to demonstrate what I was talking about earlier however this isn't the best method to demonstrate the equality between the boys and girls and these graphs seem to demonstrate the boys as being smarter then the girls. We see in these graphs even though averages show that the boys and girls are equally smart and get equally good results, we see in these graphs that the girls seem to overtake the boys in lower IQ levels as I already mentioned before but what I didn't realize prior to making these graphs is then the boys catch up and overtake the girls as IQ level goes up showing there is a higher percentage of boys with higher IQ. These graphs do not however show that there is a higher number of exceptionally high IQ levels for the girls and this should be considered so conclusions should not be taken from these two graphs.
Less important information to mention is that the program that I used to generate these graphs seemed to have drawn the line on the graph slightly inaccurately so what the graph is attempting to demonstrate isn't as clear as I would've wanted, never the less we can still see what the graph is showing but as I already mentioned, these graphs will have an impact on the conclusions but the averages will play a far greater role.
Furthering Investigation
To extend further on my investigation, I have decided to create a graph that will allow me to investigate the relationship between IQ and KS2 of all subjects. I have used a logarithm regression line. Analyzing this graph we can see that all subjects have a relationship to the IQ. Strongest being science, then maths and the weakest relationship is English. However the difference between the relationships isn't great to say the least and it is clear that all higher KS2 results generally mean a higher IQ.
I originally anticipated the Maths KS2 result to have the strongest relationship to IQ, but found out that Science has the strongest relationship which is logical since it requires many calculations and maths skills in physics and chemistry.