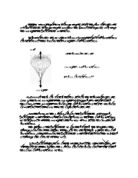
The size of the strings I decided to use is 4.30cm on which to attach the weight that will not be changed. The strings also play an important part of the rate of decent if the strings were too small the parachute would descend very quickly because the canopy would not be able to open fully not allowing as much air resistance.
I have also found a weight at which the parachute will be attached to, the weight is cylinder approximately 4cm in diameter 5.4cm in height. The overall weight of the object plus the strings is 18g. There is no reason in which I choose the shape of the object however the weight is important and if the weight is much more the 18g it will fall very quickly not allowing time to take the results.
To perform the actual investigation I needed to drop the parachute from same height 3 times and record the results, then using the same parachute and weight but changing the height I will drop it again and record the results. I am hoping to find a relationship between the rate of reaction and the height at which the parachute is dropped from. I will then produce a graph and look for any relationships. I will make sure the parachute is released not thrown at all times to maintain a fair test.
My prediction is that the higher you drop the parachute from the longer it will take to hit the floor, because the higher it is dropped from the further it has to travel, however the terminal velocity will not be reached because of the heights are not high enough and they is no-where to allow us to do this that is high enough, so this will effect the shape of the graph, so I will say that they is no terminal velocity which means that the higher it is dropped from the longer it will take and the times will increase by the same each time.
Analysis
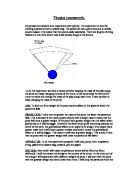
After completing my investigation into the effect of a change in height on the time taken for a parachute to fall , I have came up with the conclusion that as the height the parachute is released from increases, the time taken to fall increases. However from my graph I can be more specific and say that if the height released is doubled the time taken is approximately doubled also. For example on the graph the height 50cm gave a result of about 0.2 seconds and the height 100cm gave a result of about 0.4 seconds. I have marked these results on my graph to make it easy to see where I got this conclusion from. So from my conclusion I have come up with this set of ideal results I will also add these to my graph to be able to compare them with my results to see how accurate my results are.
On my graph I have plotted the average results I obtained for the experiment and some ideal results I worked out from my conclusion and prediction. I gathered research for my prediction from various sources such as books and the internet. On the graph I have shown a line of best fit for both sets of results. From the graph I can see that the lines of best fit are very close together which means that my results were accurate. On the graph there weren’t any anomalous results because I repeated any anomalous results and excluded them from my average so that my average results were as accurate and reliable as possible.
I now know that my conclusion matches the prediction that I made before the experiment, as my results are accurate enough and from the graph you can see that they are reliable enough to support this.