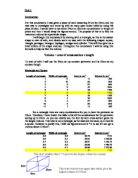
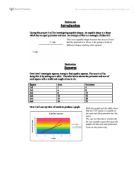
Tubes. I was given a piece of card measuring 24 cm by 32cm, and my task was to investigate and come up with as many open ended tubes by using this piece of card
Introduction: For this coursework, I was given a piece of card measuring 24 cm by 32cm, and my task was to investigate and come up with as many open ended tubes by using this piece of card. I would have to use either 24cm or 32cm as my perimeter or length of prism and then I would swap the figures around. The purpose of this is to find the maximum volume for a particular shape. I will begin this coursework by starting with a rectangle, as this is the easiest shape to start of with, and slowly work my way with the following shapes: square, triangle, pentagon, hexagon, heptagon, octagon and cylinder. This will then give me a brief outline of the shape volumes. Throughout the coursework I will be using this formula to help me find the volume: Volume = area of cross-section x length To start of with I will use the 24cm as my constant perimeter and the 32cm as my constant length. Rectangle and Square Length of rectangle Width of rectangle Area in cm2 Volume in cm3 1 1 352 2 0 20 640 3 9 27 864 4 8 32 024 5 7 35 120 6 6 36 152 7 5 35 120 8 4 32 024 9 3 27 864 0 2 20 640 1 1 352 For a rectangle there are many combinations for you to have the perimeter as 24cm. Therefore, I have drawn this table to list all the combinations for the perimeter adding up to 24cm. As you can clearly see, the 6cm by 6cm cross-section gives me the

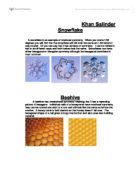
Transformation Patterns. Our aim was to take different 3 digit number patterns and make a pattern that was instructed in the worksheet, and then find a correlation between the pattern of numbers and the line of symmetry and the order of rotation.
TRANSFORMATION INVESTIGATION BY Naman Shah & Aman More Aim: Our aim was to take different 3 digit number patterns and make a pattern that was instructed in the worksheet, and then find a correlation between the pattern of numbers and the line of symmetry and the order of rotation. For example if the number chosen was X,Y,Z then we were first supposed to take a starting point, and facing up the page go x square forward and turn 90 degrees clockwise. Then we were to go y squares forward and turn 90 degrees clockwise and then go z square forward and turn 90 degrees. We were to repeat these instructions until we got the starting point. Methodology: We used the software MSWLOGO to create the shapes using the number patterns and formulae to repeat the pattern. Our formula basically gave the instructions: repeat (move x units forward, then turn 90 degrees, now move y units forward, then again turn 90 degrees, finally move z units forward and turn 90 degrees) 4 times. This caused the pattern to be repeated until the time it got back to the starting point (the small square). Using observation, we found the number of lines of symmetry (if any) for each shape, along with the order of rotation. We used this process on 28 patterns using different combinations of numbers. Note: There were many instances where there was line of symmetry. Patterns: Data table: Pattern Numbers
Symmetry in Nature
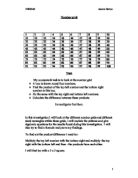
Khan Salinder Snowflake . A snowflake is an example of rotational symmetry. When you rotate it 60 degrees you will find that the snowflake will still look the same as it did before it was rotated. Or you can say that it has six lines of symmetry. It can be folded in half in six different ways and both halves look the same. Snowflakes can have either hexagonal or triangular symmetry although the hexagonal snowflake is most common. Beehive A beehive has translational symmetry meaning that it has a repeating pattern of hexagons. Individual cells of a honeycomb have rotational symmetry they can be rotated one sixth of a turn and still look like the same as before the rotation. A honey comb is built slanted so that honey doesn't fall over. The hexagonal shape of a cell gives strong construction and also uses less building material. Seashell A seashell has reflectional or bilateral symmetry. A seashell only has one line of symmetry. It can be split in half so that one side is like a mirror reflection of the other side. The lines on a seashell are arranged in such a way that you see perfect symmetry. Animal Most animals are symmetrical in at least one way. For animals, symmetry is related to fitness. Symmetrical horses can run faster than non-symmetrical horses. There are two types of animals; radiata and bilateria. Radiata has radial symmetry. Bilateria
number grid
2 3 4 5 6 7 8 9 0 1 2 3 4 5 6 7 8 9 20 21 22 23 24 25 26 27 28 29 30 31 32 33 34 35 36 37 38 39 40 41 42 43 44 45 46 47 48 49 50 51 52 53 54 55 56 57 58 59 60 61 62 63 64 65 66 67 68 69 70 71 72 73 74 75 76 77 78 79 80 81 82 83 84 85 86 87 88 89 90 91 92 93 94 95 96 97 98 99 00 Number grid Task My coursework task is to look at the number grid * A box is drawn round four numbers. * Find the product of the top left number and the bottom right number in this box. * Do the same with the top right and bottom left numbers. * Calculate the difference between these products. Investigate further. In this investigation I will look at the different number grids and different sized rectangles within these grids, I will explain the patterns and give algebraic equations for the results found during this investigation. I will also try to find a formula and prove my findings. To find out the product difference I need to:- Multiply the top left number with the bottom right and multiply the top right with the bottom left and then - the products from each other. I will first try with a 2 x 2 square. 2 13 22 23 a) 2 x 23 = 276 The difference of the two products are 10. 3 x 22 = 286 I worked the difference out by doing, 286-276 = 10 38 39 48 49 b) 38 x 49 =
Maths -Borders
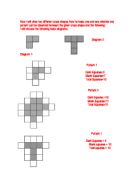
Now I will draw two different cross shapes from its basic one and see whether any pattern can be observed between the given cross shape and the following: I will choose the following basic diagrams. Diagram 2 Diagram 1 Pattern 1 Dark Squares=3 Blank Squares=7 Total Squares=10 Pattern 2 Dark Squares =10 Blank Squares=11 Total Squares=21 Pattern 1 Dark Squares = 5 Blank squares = 10 Total squares = 15 Pattern 2 Dark Squares=15 Blank Squares=14 Total Squares=29 Observations: * Pattern 1 in diagram 1 consists of an even number of squares while the dark squares in the same pattern are odd and the blank squares are also odd, I noticed that the sum of two odd figures is an even value. * In pattern 2 in diagram 1 an odd number of squares was added to an even number hence the total value is odd. * In pattern 1, diagram 2 the total number of squares, the number of blank squares and the number of dark squares are all multiples of 5. * In pattern 2, diagram 2 the difference between dark squares and blank squares is odd and the difference between the blank squares and total squares is also odd. The previous shape is the extended version of the original cross shape it is surrounded by 16 outer layer squares and contains a total of 41 squares. I will extend it one more time, which will look like this: The shape above is surrounded by 20 blank outer layer squares and
Equable shapes
Section one Introduction During this project I will be investigating equable shapes. An equable shape is a shape which has an equal perimeter and area. An example of this is a rectangle of sides 6x3. Section two Squares First I shall investigate squares, trying to find equable squares. The way I will be doing this is by setting out a table. The table below shows the perimeter and area of each square with a width and length of one to six. Square Area Perimeter x1 4 2x2 4 8 3x3 9 2 4x4 6 6 5x5 25 20 6x6 36 24 Now I will use my table of results to produce a graph. Section Three Rectangles I started investigating rectangles by filling in different tables. The first table I did kept a fixed width of 1 (shown below is the table showing my results). Rectangle Area Perimeter x1 4 x2 2 6 x3 3 8 x4 4 0 x5 5 2 x6 6 4 x7 7 6 x8 8 8 x9 9 20 Rectangle Area Perimeter 2x1 2 6 2x2 4 8 2x3 6 0 2x4 8 2 2x5 0 4 By looking at this graph we can see that the linear graphs for area and perimeter are parallel. This suggests that we can't have an equable rectangle with a width of 2. Now I will try to prove this algebraically. Area = 2L Perimeter = 2L+4 2L=2L+4 2L-2L=4 0L=4 L= Clearly, you can't have a rectangle that is infinitely long. I was right in thinking an equable rectangle with a fixed width of 2 doesn't
Graphing Quadratic Functions
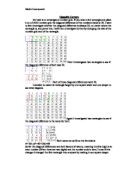
Caitlin Holford 30/03/09 Math Investigation GRAPHING QUADRATIC FUNCTIONS: INVESTIGATION In all of the following questions, we will investigate the equations as y = x2 and see what happens to their graphs when we add, subtract or multiply by different constants. Firstly, we will add k to the equation, where k is a constant, giving us y = x2 + k I chose 5 different values for k giving us: y1 = x2 + 6 y2 = x2 + 5 y3 = x2 - 8 y4 = x2 + 22 y5 = x2 - 15 After having used these values and calculated them against x equaling -3, -2, -1, 0, 1, 2 and 3, I was able to obtain the following table: x y1 y2 y3 y4 y5 -3 5 4 31 -6 -2 0 9 -4 26 -11 -1 7 6 -7 23 -14 0 6 5 -8 22 -15 7 6 -7 23 -14 2 0 9 -4 26 -11 3 5 4 31 -6 Graph of y = x2 + k Using these values I was able to make a graph using them and y = x2 to show the difference between the two equations: As we can see in the above graph, the vertex (turning point of a graph) is located every time on the y-axis. The parabola is the same size and shape though it is translated vertically, depending on the value of k. The reason why the parabola is translated rests with the fact that we either adding or subtracting a certain value from all points on the graph, thus pushing the graph up or down the y-axis. Another point worth mentioning would be that the vertex is actually the
Maths Opposite corners
Opposite Corners My task is to investigate a number grid. If you take a 2x3 rectangle and place it on a 10x10 number grid the diagonal difference of the numbers inside is 20. I want to first investigate whether the diagonal difference is always 20, no matter where the rectangle is, and prove this. I will then investigate further by changing the size of the number grid and of the rectangle. First I investigated two rectangles to see if the diagonal difference of both was 20. Both of these diagonal differences were 20. I decided to make the rectangle larger by one square wider and one deeper to see what happens. Again I investigated two rectangles to see if the diagonal difference is the same for both. Both came out as 60 so the formula is: x²+23x-(x²+60+23x)=60 So far the diagonal differences are both factors of twenty, meaning the first digit is an even number (When there are two digits) and the number ends in zero.To see if this changes I changed the first rectangle into a square by making it one square deeper. Both of the diagonal differences were 40. In a rectangle of 3 X 2 the diagonal difference was 20. This went up by 20 when I deepened the rectangle by one square. I then investigated whether the diagonal difference will go up by another 20 if I deepened the rectangle by another square. Both these were 60. So the diagonal difference has risen by 20 again.
Guttering Investigation
Guttering Coursework Guttering Coursework In my investigation I will be looking at guttering, where I will try and find the best type; that is the one which holds the greatest volume of water. I was walking around my hometown of Antrim where I noticed how all the guttering was made into a semi circular open top shape. I wondered if this is because this is the shape which holds most water or is it because it is the cheapest to manufacture. My hypothesis is that semi circular guttering will hold the greatest volume of water. I will now investigate to see whether my hypothesis is true of whether there is another which can hold a larger volume of water. I will use a sheet of plastic and fold it into different shapes. I will find out the shapes' cross sectional area rather than the volume as it is easier and the length will be the same so it is only the cross sectional area that varies. I will fold a sheet of paper into different shapes to help me visualise the different shapes possible. I will be investigating guttering which will have a perimeter of "B" cm. In one case I will be using "18cm" which happens to be the length of the piece of paper I am using. Semi Circular Guttering Cross Section As this appears to be the most commonly used guttering and it is the type I have based my hypothesis on, I shall investigate its cross sectional area first so I can use it as a
Box Coursework
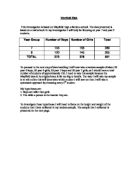
Mayfield High This investigation is based on Mayfield high a factious school. The data presented is based on a real school. In my investigation I will only be focusing on year 7 and year 9 students. Year Group Number of Boys Number of Girls Total 7 53 33 286 9 20 45 265 TOTAL 273 278 551 To proceed to the next step of data handling I will now take a random sample of about 30 year 9 boys, 30 year 9 girls, 30 year 7 boys and 30 year 7 girls, so I should have a total number of students of approximately 120. I need to take this sample because the Mayfield data in its original state is far too big to handle. The way I will take my sample is to role a dice this will determine which student I will start on then I will take a systematic approach by choosing every 5th student. My hypotheses are: . Boys are taller than girls 2. The taller a person is the heavier they are. To investigate these hypotheses I will need to focus on the height and weight of the students that I have collected in my random sample. The sample that I collected is presented on the next page. Now that I have my samples of data I will present then in the form of a cumulative frequency table. Boys Height (cm) Tally Frequency Cumulative Frequency 30?h<140 l 40?h<150 lllll l 6 7 50?h<160 lllll lllll lllll lllll lll 23 30 60?h<170 lllll lllll llll 4 44 70?h<180 lllll