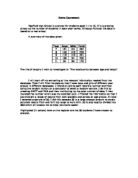
My bar shows that my randomly chosen sample of 30 pupils consists mainly of 14 year olds and not many 17 year olds.
I have extracted the randomly selected 30 students from the database and recorded their height, weight, gender and age in a table. I have given each pupil a number allowing me to extract further information easily.
I have represented my data as cumulative frequency charts. The first chart shows the age and the second chart shows the height.
A Cumulative frequency graph of the ages to the nearest year
A Cumulative frequency chart of the height (m)
The bar chart suggests that the modal age for students is 14.
The evidence from my sample suggests that at Mayfield High School there are likely to be fewer people who are taller than 180 cm.
Extending my information
To extend my investigation I will be looking at the relationship between age and height between girls and boys. To extend my line of enquiry I will be testing out the hypothesis:
‘In general, the older the person the taller that person is likely to be’
A New Sample
To extend the difference between boys and girls, I will need to take a new sample. I need to take an equal number of girls and boys from each year so I have randomly selected 6 boys and 6 girls from each year giving me a varied sample of 30 boys and girls. I have highlighted (in blue) the randomly selected 30 on the database.
I have collated the 30 boys and 30 girls that I randomly selected from the data into 1 table.
I need a more useful way of representing both sets of data so I have drawn frequency table for age and height and have separated the boys from the girls.
Boys
Girls
I will start off by recording my results onto a diagram. Then I can begin analyzing the data about age using bar charts to compare the results for boys and girls.
A bar chart showing the frequency of the boys’ ages
A bar chart showing the frequency of the girls’ ages
As the age of the students is discrete data, the best way in which to compare them is to use a dual bar chart. I can use a dual bar chart because there are the same number of boys and girls in my sample.
A dual bar chart of the ages of both boys and girls
The mode age for the girls in my sample was higher than the mode shoe size for the boys.
The evidence from my sample suggest that not many girls are younger than 13 or older than 16 whereas the distribution of ages for boys are evenly spread out throughout the ages.
Mean ages
Mean can be calculated easily from the frequency tables. If f is the frequency and x is the age then the mean for the boys is:
= (4x12) + (6x13) + (6x14) + (7x15) + (4x16) + (3x17)
4 + 6 + 6 + 7 + 4 + 3
And the mean age for the girls is:
= (1x12) + (9x13) + (7x14) + (4x15) + (8x16) + (1x17)
1 + 9 + 7 + 4 + 8 + 1
Mean age for boys = 14.34
Mean age for girls = 14.4
Modal ages
I can read the modes of the ages for boys and girls straight off my bar charts or frequency tables:
Modal age for boys = 15
Modal age for girls = 13
Median ages
There are 30 people in each sample, so the median will be half way between the 15th and 16th values:
Median age for boys = 14
Median age for girls = 14
Range of ages
The range of ages will show you how spread out my data is:
Range of ages for boys = 5
Range of ages for girls = 5
I can summarise these results in a table:
The three measures of average (mean, median and mode) aren’t consistent enough for me to come to a conclusion of which gender is older. The mean suggests by a small percentage that girls are older than boys whereas the mode suggests the total opposite. The median is the same for both the girls and the boys. This draws me to a conclusion that the ages of both the boys and girls are more a less the same.
Evidence suggests that 23 out of 30, or 76% of boys are under the age of 15 whereas only 21 out of 30, or 70% of girls were under the age of 15.
Height
I cannot analyse the data about the height in exactly the same way. Because height is continuous, I need to record it on a histogram.
Histogram of boy’s heights
Histogram of girl’s heights
I can compare continuous data by drawing the frequency polygons on the same graph.
Since the data is grouped into class intervals, it also makes sense to record it in a stem and leaf diagram. This will make it easier to read off the median values.
Boys
Girls
Averages
You can also record the mean, median and range for the data. Because the data is continuous it makes more sense to find the modal class interval rather than the mode. This is the class interval that contains the most values. The values for the mean and median have been rounded.
All three measures of average in the sample were higher for boys than for girls, though the sample for boys was more spread out, with a range of 0.64m compared to 0.39m for girls. The evidence from the sample suggest that 3 out of 30, or 10% of the boys were over 180cm tall whereas only 1 out of 30, or 3.3% of the girls were above 180cm. The frequency polygons show that there are fewer boys with heights below 160cm than girls.
These conclusions are based on a sample of only 30 girls and 30 boys. I cold extend the sample or repeat the whole exercise to confirm my results.
Comparing age and height
To extend the investigation I have made the hypothesis:
“In general the older the person, the taller that person is likely to be.”
To test this hypothesis I need a new sample of 30 students. I am going to use the sample I chose at the beginning of this investigation.
The most suitable way to compare this data is to draw a scatter diagram:
A scatter diagram of age and height
There is a slight positive correlation for the younger pupils however the correlation starts to scatter after the age of 14 eventually ending with no correlation.
The line of best fit can be used to estimate that somebody aged 13 will be approximately 158cm tall.
Further investigation
In the early part of the investigation I found evidence to suggest that age and height are both affected by gender. A natural next step is to extend my line of enquiry to investigate how the correlation between height and age is affected by gender. I will test the hypothesis:
There will be a better correlation between age and height if I consider boys and girls separately.
I already have random samples of 30 boys and 30 girls that I can use to test this hypothesis. I will plot separate scatter diagrams for the boys and the girls, and one for the whole sample.
Scatter diagram for boys
Scatter diagram for girls
Scatter diagram for mixed population
The evidence supports our hypothesis:
There is a stronger correlation between age and height if boys and girls are considered separately.
This is particular obvious in the scatter graph for the boys.
The line of best fit on each scatter diagram can be used to make predictions:
The lines of best fit on my diagram predicts that a girl aged 14 would be approximately 151cm tall whereas a boy of the same age would be approximately 160cm tall.
Using the equation I was able to find the equation of the line of best fit in all three diagrams. If represents height in cm, and represents age , the equations of the lines of best fit for my data set are:
Boys only:
Girls only:
Combined sample:
These equations can be used to make predictions of height when one knows the height. For example, to predict the height of a 13 year old boy:
All the heights in the data are rounded to the nearest cm, so I should round this value to the nearest centimeter.
Using the equation of my lines of best fits, I can predict that a boy aged 13 is approximately 161cm tall.
The line of best is a best estimation of relationship between age and height. There are exceptional values in my data (such as the boy who is 206cm tall) which fall outside the general trend. The line of best fit is a continuous relationship, though age is a discrete variable. Rounding ages and heights to the nearest whole number makes my predictions less accurate.
Cumulative frequency can be a very powerful tool when comparing different data sets. This table shows the cumulative frequency for ages for boys, girls and for the mixed sample.
The best way of representing this information on a diagram is to draw cumulative frequency curves. If the curves are drawn on the axis, it is easier to compare the results.
Cumulative frequency curves for ages
The curves clearly show the trend towards higher age amongst boys and girls. However the curve is a continuous measure of cumulative frequency, and ages is a discrete variable. Cumulative frequency curves would be more appropriate when using heights.