GCSE statistics coursework
GCSE statistics coursework In this coursework I am going to investigate the affect that age has on the car. I am going to look at price, engine size, mileage, and age of the car. By the end of the coursework I am aiming to have a set of results about how the cars are affected by the age, price and mileage. My prediction should show that * As the car increases its price will decrease * The higher the mileage the price will decrease. Plan I am going to be collecting a sample of 100 cars. I will find mean, median, mode and range for some certain makes of cars, from the data I have been given. I will then represent my data by the following diagrams * Bar charts * Tally charts * Pie charts * Standard deviation (mean and mean deviation) * Scatter diagrams. The reason why I am doing so many diagrams is to give a clear understanding and also to give the reader a pictorial view about what is happening, and also I must say to get more accurate results. The diagrams would maintain a clear understanding and show what is happening to the cars and what people prefer according to their engine size. After each of the diagram I would explain how I did the diagram and what people prefer and why. I would compare the mean, median and mode to support my hypothesis. At the end of the coursework I would be doing a conclusion explaining what has happened and why. I am going to

The Gradient Function.
The Gradient Function I am trying to find a formula that will work out the gradient of any line (the gradient function) I am going to start with the simplest cases, e.g. y=x² as they are probably going to be the easiest equations to solve as they are likely to be less complex and hopefully the formulas to the more complex equations will be easier to discover by looking at the previous formulas. I am going to look at the line y=x² first. y=x² X 2 3 4 y 4 9 6 One of the most obvious things I notice is that as the co-ordinates increase so does the gradient. Not only can you see that from the results below, but also on the graph you can that the line gets steeper and steeper. This makes sense as the higher the number x is the larger the difference between x² and x. Another thing that I have noticed is that the larger the co-ordinates the smaller the increase in gradient. Point Gradient (tangent) Gradient (Small Increment Method) (1,1) 2 2.01 (2,4) 3.3 3.01 (3,9) 6.36 (2dp) 6.01 (3.5,12.3) 6.4 7.001 As the table above shows there are two methods that I am using for calculating the gradient of line. The first being drawing a tangent at the point, working out the distances on the tangent using the scale on the graph and then using this formula: dy/dx However there is another way called small increment method. This method gives a more
Beyond pythagoras - This investigation is about Pythagorean triples and the similarities between them.
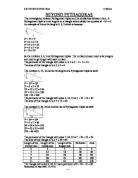
BEYOND PYTHAGORAS This investigation is about Pythagorean triples and the similarities between them. A Pythagorean triple is three lengths on a triangle which satisfy the equation a² + b² = c². An example of this is the lengths 3, 4, 5 which is because: 3² + 4² = 5² 3² = 3 x 3 = 9 4² = 4 x 4 = 16 5² = 5 x 5 = 25 9 + 16 = 25 So the numbers 3, 4, 5 are Pythagorean triples. The numbers chosen need to be integers and need to get longer with each number. The perimeter of the triangle with sides 3, 4, 5 is 3 + 4 + 5 = 12. The area of this triangle is 1/2 x 3 x 4 = 6 The numbers 5, 12, 13 can be the lengths of a Pythagorean triple as well: 5² + 12² = 13² 5² = 5 x 5 = 25 2² = 12 x 12 = 144 3² = 13 x 13 = 169 44 + 25 = 169 The perimeter of the triangle with sides 5, 12, 13 is 5 + 12 + 13 = 30 The area of this triangle is 1/2 x 5 x 12 = 30 The numbers 7, 24, 25 are another set of Pythagorean triples as well: 7² + 24² = 25² 7² = 7 x 7 = 49 24² = 24 x 24 = 576 25² = 25 x 25 = 625 576 + 49 =625 The perimeter of the triangle with sides 7, 24, 25 is 7 + 24 + 25 = 56 The area of this triangle is 1/2 x 7 x 24 = 84 Length of the shortest side Length of the middle side Length of the longest side Perimeter Area 3 4 5 2 6 5 2 3 30 30 7 24 25 56 84 9 40 41 90 80 1 60 61 32 330 The triangle with sides 9, 40, 41 has a
Emma's Dilemma Question One: Investigate the number of different arrangements of the letters
Emma's Dilemma Question One: Investigate the number of different arrangements of the letters of Emma's name. Question Two: Emma has a friend named Lucy, Investigate the number of different arrangements of the letters of Lucy's name. Question Three: Choose some different names. Investigate the number of different arrangements of the letters of names you have chosen. Question Four: A number of X's and a number of Y's are written in a row such as XX.........XXYY.........Y Investigate the number of different arrangements of the letters. Question One: Investigate the number of different arrangements of the letters of EMMA's name. Answer: In order for me to answer this question, I will write down all of the different arrangements for the letters of Emma's name. This will allow me to get the total number of arrangements, which will help me to find a rule in the latter questions in this piece of coursework. Below are all of the different arrangements of the letters of Emma's name: EMMA EMAM EAMM MEMA Total: MEAM 12 MAEM MAME MMEA MMAE AMME AMEM AEMM From my results, I can see that there are 12 different combinations of the letters from Emma's name, if all of the letters are used, and only once. I have set out the letters in an ordered fashion, so that it is easier to find all of the combinations, and to only do a combination once. Therefore, my
Analyse how student's marks in a maths test react with or without music being played.
Maths Coursework (Music and work) Introduction This investigation is to analyse how student's marks in a maths test react with or without music being played. Hypothesis My hypothesis is: . For my hypotheses I think when music is played the students will perform badly but when music is not played pupils will perform better. I have now chosen my hypothesis. I have chosen these because I think these are relevant to the test when music is played or is not. Depending on the students interest in music the hypothesis might differ so if a student likes the music being played then they might perform better. If the student dislikes the music being played then they might perform not so well or worse. Action Plan Music will be played while students are taking the tests, the tests will be mental arithmetic. The tests will be conducted in 8 different AS maths groups. There are 2 statistics groups 2 mechanics groups 2 decision groups and 2 further maths groups. 1 of the groups from each different maths group will take the test with music played and the other will do the test without. This no means we will get a fair result from each of the two groups. The investigation will be made fair by having the same conditions in each room. The same track will played for all groups. Volume will be recorded and made the same in each groups room. We have come to a decision to choose a
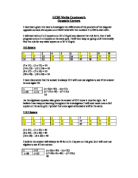
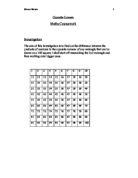
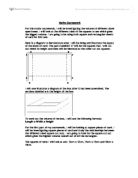
Mathematics Handling Data Coursework: How well can you estimate length?
Mathematics Handling Data Coursework: How well can you estimate length? Introduction A school teacher asks two sets of students to estimate the length, in metres and to two decimal places, of a 1.58 metre long stick, held up horizontally in front of them; this is to prevent pupils from comparing the stick to the teacher's height. 178 Year Eleven pupils and 173 Year Seven pupils are asked. Hypothesis I believe that the Year Eleven pupils will be more accurate in their estimation than those in Year Seven. This is because they are older, more knowledgeable at Mathematics and have also been estimating lengths for a longer amount of time than Year Sevens. My Plan As there are over 170 pupils in each year, I will only be using a sample of fifty pupils from each year. I will randomly select these fifty pupils, using a certain method. I will then group my fifty data values into a grouped frequency table. This is because fifty is still a large number of lengths to be dealing with when carrying out certain calculations. Using my random data values, first I will calculate the mean. The mean is a type of average, which represents the pupils' accuracy at estimation. As I believe that Year Eleven's estimations will be more accurate than the Year Seven's, I therefore predict Year Eleven's mean value to be close to 1.58m. Next I will calculate the standard deviation of the two data
'Broad-sheets are more difficult to read as tabloid newspapers' discuss.
Maths Coursework: Statistics Different newspapers are written to suit different preferences. Tabloids are a lighter read whereas broad-sheets involve more 'serious' and detailed articles. My hypothesis is that broad-sheets are more difficult to read as tabloid newspapers summarise events using less profound wording, which makes articles more easily understood than broad-sheet articles. Tabloids also try to attract and hold the attention of the reader more. To see whether my hypothesis is true, I will have to compare statistically certain data between a broad-sheet newspaper and a tabloid newspaper concerning articles on similar topics and the size of certain varying texts. The difficulty of the reading can be measured by certain factors: word length, sentence length, paragraph length, article length, the time taken to read an article, area of article on page, area of headline on page etc... I have decided, for the experiment, I will compare word length- the amount of letters in a word; sentence length- the amount of words in a sentence; and percentage area of headline text that makes up the newspaper page excluding margins, pictures and other texts. I have chosen these three factors as the longer the word or sentence, the more concentration is needed to read and focus on what is being said. However, the percentage area of a headline is to prove how much of the newspaper is
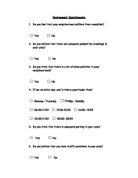
Environment Questionnaire
Environment Questionnaire . Do you feel that your neighborhood suffers from vandalism? ? Yes ? No 2. Do you believe that there are adequate pedestrian crossings in your area? ? Yes ? No 3. Do you think that there is a lot of noise pollution in your neighbourhood? ? Yes ? No 4. If so; on which day, and is there a particular time? ? Monday- Thursday ? Friday- Sunday ? 06:00-11:59 ? 12:00-15:59 ? 16:00- 19:59 ? 20:00-11:59 ? 00:00- 05:59 5. Do you think that there is adequate parking in your area? ? Yes ? No 6. Do you believe that you have traffic problems in your area? ? Yes ? No 7. Do you think that there is adequate lighting in your area? ? Yes ? No 8. Do you think that it is safe to go out at night? ? Yes ? No 9. How happy would you be to let your children play outside without parental provision? ? Very Happy ? Happy ? Not so happy ? I wouldn't allow it 0. Do you think that there is adequate security in your area? ? Yes ? No 1. Would you be happy to leave your house empty for long periods of time? ? Yes ? No 2. Do you think that there is a lot of air pollution in your area? ? Yes ?

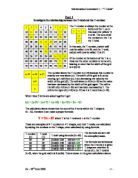
T-Totals. We have a grid nine by nine with the numbers starting from 1 to 81. There is a shape in the grid called the t-shape.
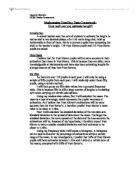
T-Totals PART 1 We have a grid nine by nine with the numbers starting from 1 to 81. There is a shape in the grid called the t-shape. This is highlighted in the colour red. This is shown below: - 2 3 4 5 6 7 8 9 0 1 2 3 4 5 6 7 8 9 20 21 22 23 24 25 26 27 28 29 30 31 32 33 34 35 36 37 38 39 40 41 42 43 44 45 46 47 48 49 50 51 52 53 54 55 56 57 58 59 60 61 62 63 64 65 66 67 68 69 70 71 72 73 74 75 76 77 78 79 80 81 The number 20 at the bottom of the t-shape will be called the t-number. All the numbers highlighted will be called the t-total. In this section there is an investigation between the t-total and the t-number. 2 3 4 5 6 7 8 9 0 1 2 3 4 5 6 7 8 9 20 21 22 23 24 25 26 27 28 29 30 31 32 33 34 35 36 37 38 39 40 41 42 43 44 45 46 47 48 49 50 51 52 53 54 55 56 57 58 59 60 61 62 63 64 65 66 67 68 69 70 71 72 73 74 75 76 77 78 79 80 81 For this t-shape the T-number is 20 and the T-total is37 For this t-shape the T-number is 21 And the T-total is 42. As you can see from this information is that every time the t-number goes up one the t-total goes up five. Therefore the ratio between the t-number and the t-total is 1:5. This helps us because when we want to translate a t-shape to another position. Say we move

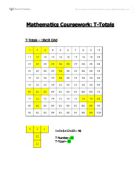
T- Total. You will notice that the centre column of the T-Shape is going up in 9s because of the table size. With the table set out like this a formula can be worked out to find any T-Total on this size grid.
T- Total 2 3 4 5 6 7 8 9 0 1 2 3 4 5 6 7 8 9 20 21 22 23 24 25 26 27 28 29 30 31 32 33 34 35 36 37 38 39 40 41 42 43 44 45 46 47 48 49 50 51 52 53 54 55 56 57 58 59 60 61 62 63 64 65 66 67 68 69 70 71 72 73 74 75 76 77 78 79 80 81 Look at the T-shape drawn on the 9 by 9 number grid. The total of the numbers inside the T-shape is 1+2+3+11+20=37 This is called the T-total. The number at the bottom of the T-shape is called theT-number. The T-number for this T-shape is 20. If you take the other numbers in the T-Shape away from the T-Number you get a T-Shape like this. T-17 T-18 T-19 T-9 T You will notice that the centre column of the T-Shape is going up in 9's because of the table size. With the table set out like this a formula can be worked out to find any T-Total on this size grid. This is done in the working below:- T-total = T-19+T-18+T-17+T-9+T = 5T-63 Now to test this formula to see if it works For T-Total I will use the letter X For the T-Number I will use the letter T So X = 5T-63 T = 20 X = 5x20-63 = 100-63 = 37 Now I will do two more to check to see if it will work anywhere on the grid. T=43 X=5x43-63 24+25+26+34+43=152 X=215-63 X=152 T=49 X=5x49-63 30+31+32+40+49=182 X=245-63 X=182 I have tested the formula for three different T-numbers and the formula