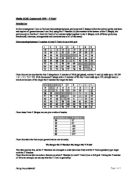
Used Cards - find which factors will influence the price of a second hand car and in what way
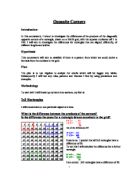
Maths Statistics - Used Cars Pilot Study Aim The aim of the coursework is to find which factors will influence the price of a second hand car and in what way. I believe that the price second hand cars are sold at is dependant upon several factors; certain factors will have a much larger effect on the price than others. In my investigation I am going to chose the two most popular (this being the most amount of a specific make provided by Edexcel of two specific makes) manufacturers of cars from a tally chart of all of the cars because the thing that people look at first when they are buying a car is the make and I believe this is what will affect the second hand price also. Different makes have different prices and depreciate every year at different rate resulting in sum cars holding their value due to the make. In addition certain cars have a very good reputation of being reliable while others are not. Also some cars have a higher social status than others for example people would prefer a Mercedes over a Ford. Before I commenced with developing a hypothesis, I firstly explored and tried to discover any data, information or details needed for my statistic coursework. Previous to this, I was given a candidate sheet that provided me with factors which I may have liked to consider. The factors are: * Price * Age * Mileage * Cost when new * Engine size * Colour *
The T-Total Mathematics Coursework Task.
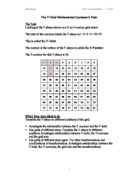
The T-Total Mathematics Coursework Task The Task Looking at the T-shape drawn on a 9 by 9 number grid below. The total of the numbers inside the T-shape is 1+2+3+11+20=37 This is called the T-Total. The number at the bottom of the T-shape is called the T-Number. The T-number for this T-shape is 20. 2 3 4 5 6 7 8 9 0 1 2 3 4 5 6 7 8 9 20 21 22 23 24 25 26 27 28 29 30 31 32 33 34 35 36 37 38 39 40 41 42 43 44 45 46 47 48 49 50 51 52 53 54 55 56 57 58 59 60 61 62 63 64 65 66 67 68 69 70 71 72 73 74 75 76 77 78 79 80 81 What I have been asked to do Translate the T-shape to different positions of the grid. * Investigate the relationship between the T-number and the T-total * Use grids of different sizes. Translate the T-shape to different positions. Investigate relationships between T-total, the T-numbers and the grid size. * Use grids of different sizes again. Try other transformations and combinations of transformations. Investigate relationships between the T-total, the T-numbers, the grid size and the transformations. The Method I have chosen I will follow my plan below while following the task and customizing it to achieve maximum marks. * I will first draw out one or two 9 by 9 number grids. Then I will fill in T-shapes until I see a pattern, each shape will be in a different colour
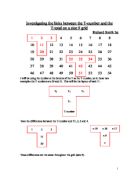
Investigating the links between the T-number and the T-total on a size 9 grid
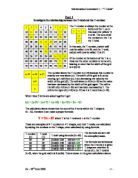
Investigating the links between the T-number and the T-total on a size 9 grid Richard Smith 5? 2 3 4 5 6 7 8 9 0 1 2 3 4 5 6 7 8 9 20 21 22 23 24 25 26 27 28 29 30 31 32 33 34 35 36 37 38 39 40 41 42 43 44 45 46 47 48 49 50 51 52 53 54 I will be using the number at the bottom of the T as the T-number, so in these two examples the T-numbers are 20 and 51. This will be the layout of each T: - T2 T3 T4 T1 T-number Take the differences between the T-number and T1, 2, 3 and 4. n-19 n-18 n-17 n-9 n 2 3 1 20 These differences are the same throughout the grid (size 9). Examples n-19 n-18 n-17 n-9 n 32 33 34 42 51 n-19 n-18 n-17 n-9 n 6 7 8 26 35 If you take all the differences, which add up to be -63 and take that from 5 (the amount of numbers in one T) multiplied by the T-number, it gives you the T-total. Here is the formula: - 5n-63=T-total I will now test this formula using some of the T shapes above. 6 7 8 26 35 2 3 1 20 32 33 34 42 51 5n-63 = T-total 5(20)-63 = T-total 37 = T-total Also: + 2 + 3 + 11 +20 = 37 5n-63 = T-total 5(51)-63 = T-total 92 = T-total Also: 32 + 33 + 34 + 42 + 51 = 192 5n-63 = T-total 5(35)-63 = T-total 12 = T-total Also: 6 + 17 + 18 + 26 + 35 = 112 As I have proved, the formula is correct for the T shape in a grid size of 9.

How the mass and height of the pupils differ from each other in different year groups. Hypotheses:
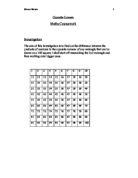
Maths Coursework PLANNING Introduction: This piece of coursework that is going to be studied is about Data Handling. The data I will be looking at will be from Mayfield High. There is a whole database of information available and I will be looking at two specific pieces of data. When examining this set of data I will then be able to make various hypotheses to investigate my project with. I will then draw conclusions on the data from my results. I will also draw graphs that are relevant to prove my point. The two pieces of data that I will be investigating are: > How the mass and height of the pupils differ from each other in different year groups. Hypotheses: There will be a main theme for my main hypotheses, which will be split up into three hypotheses. The main theme however will be height and mass. ) Boys are taller than girls in Year 7 and 8. Aim: I will show this data by, firstly, plotting all the heights of boys and girls on separate so I can compare the heights of all the pupils and can easily see the spread of data. Then I will calculate the average height of the boys and girls to clearly see the taller gender. Furthermore, to prove my hypothesis I will plot a cumulative frequency graph with a box and whisker diagram with boys and girls on the same graph. This will show the quartiles of the data, the spread of the data and the median. I will also use standard
T totals. In this investigation I aim to find out relationships between grid sizes and T shapes within the relative grids, and state and explain all generalizations I can find
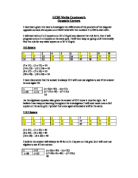
Maths GCSE Coursework 2000 - T-Total INTRODUCTION - Tell the reader what the project is all about - get a friend/family member to read it - do they understand what it's all about? Introduction In this investigation I aim to find out relationships between grid sizes and T shapes within the relative grids, and state and explain all generalizations I can find, using the T-Number (x) (the number at the bottom of the T-Shape), the grid size (g) to find the T-Total (t) (Total of all number added together in the T-Shape), with different grid sizes, translations, rotations, enlargements and combinations of all of the stated. EXPLAIN WHAT THE LETTERS STAND FOR Relations ships between T-number (x) and T-Total (t) on a 9x9 grid 2 3 4 5 6 7 8 9 0 1 2 3 4 5 6 7 8 9 20 21 22 23 24 25 26 27 28 29 30 31 32 33 34 35 36 37 38 39 40 41 42 43 44 45 46 47 48 49 50 51 52 53 54 55 56 57 58 59 60 61 62 63 64 65 66 67 68 69 70 71 72 73 74 75 76 77 78 79 80 81 From this we can see that the first T shape has a T number of 50 (highlighted), and the T-total (t) adds up to 187 (50 + 41 + 31 + 32 + 33). With the second T shape with a T number of 80, the T-total adds up to 337, straight away a trend can be seen of the larger the T number the larger the total. 2 3 4 5 6 7 8 9 0 1 2 3 4 5 6 7 8 9 20 21
Maths Statistics Coursework - relationship between the weight and height
Planning Introduction: In this investigation, I am aiming to find out information on the relationship between the weight and height and the relationship between the age and height. Hypotheses: * As the height increases, the weight increases * As the age increases, the height increases * Boys have a higher average height than girls Justification: I think that as someone's height increases, their weight increases. I predict this because of basic knowledge of the human body. As someone's body grows, it the muscles, bones and fat on the body increases and gets larger. And as these increase, they make the body weigh more. I will present this data in scatter graphs for boys, girls and both. I will use Microsoft Excel to create this graph because I think that it will prevent human error and it will enable me to change the scales or any other amendments at any time with ease. This will help me compare and contrast the different genders' heights and weights. To give me knowledge of the correct correlation, I will use product-moment correlation coefficient which is a calculation that shows the correlation value of the data. For all the scatter graphs, I will construct them by using Microsoft Excel which will allow me to group the data to present them into scatter graphs. I predict that as the student gets older, their height also increases for all boys and girls. This is
Tabloid Newspaper - The Sun statistical analysis.
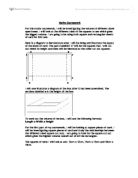
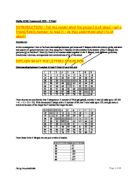
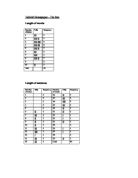
Tabloid Newspaper - The Sun Length of words Number of words Tally Frequency Number of words Tally Frequency 0 6 II 2 2 0 7 III 3 3 0 8 IIII 5 4 0 9 III 3 5 0 20 II 2 6 II 2 21 II 2 7 III 3 22 I 8 II 2 23 I 9 II 2 24 II 2 0 II 2 25 0 1 III 3 26 I 2 IIII 4 27 I 3 I 28 0 4 III 3 29 II 2 5 III 3 Total 50 Number of letters Tally Frequency III 3 2 IIII II 7 3 IIII IIII 9 4 IIII III 8 5 IIII II 7 6 III 3 7 IIII 4 8 IIII II 7 9 0 0 II 2 Total 50 Length of sentence Broadsheet newspaper - The Times Length of words Number of letters Tally Frequency I 2 IIII I 6 3 IIII II 7 4 IIII IIII 9 5 IIII IIII I 1 6 IIII 5 7 IIII 4 8 IIII 4 9 I 0 0 1 II 2 Total 50 Length of sentence Number of words Tally Frequency Number of words Tally Frequency 0 25 III 3 2 0 26 I 3 0 27 0 4 0 28 I 5 0 29 I 6 I 30 I 7 III 3 31 III 3 8 I 32 II 2 9 III 3 33 I 0 II 2 34 0 1 II 2 35 I 2 I 36 0 3 I 37 0 4 I 38 I 5 II 2 39 0 6 III 3 40 0 7 III 3 41 0 8 I 42 0 9 IIII 4 43 0 20 I 44 0 21 I 45 0 22 II 2 46 0 23 I 47 I 24 I Total 50 Length of words Length of sentence Word length Frequency (Tabloid) Frequency (Broadsheet) 3 2 7 6 3 9 7 4 8

I will be testing the following hypothesis in my pilot study: The taller the student the heavier the student will be
Statistics Coursework: Mayfield High School In this coursework I will be looking at data collected from students at a fabricated school Mayfield High School. I was given information about things for each pupil such as age, IQ, weight, height of the students the school. From the data I was given I had to come up with a line of enquiry to explore. I will be using statistical presentation methods like graphs and other various calculations to test the hypotheses. I am going to be looking at the height and weight of students at the school to see if the increase in height reflects the weight of a person and vice versa. The data I am going to be looking at is secondary data. The advantages of this are that it saves time (if correct) in collecting the data. Furthermore, secondary data allows me access to data that I could not have otherwise got. However a disadvantage is that it may not be accurate could have parts of the data missing. The data could be biased. This means that there is not an equal chance for each student to be chosen at random. Furthermore, I also will not have any knowledge of the fact that it may be biased, as the person collecting the data may have changed it to their benefit, and also because I did not collect the data as it was done for me. The data may also be out-of-date. I could have used primary data. This is because, unlike secondary data, it would

Maths GCSE Coursework – T-Total
Maths GCSE Coursework 2000 - T-Total Introduction In this investigation I aim to find out relationships between grid sizes and T shapes within the relative grids, and state and explain all generalizations I can find, using the T-Number (x) (the number at the bottom of the T-Shape), the grid size (g) to find the T-Total (t) (Total of all number added together in the T-Shape), with different grid sizes, translations, rotations, enlargements and combinations of all of the stated. Relations ships between T-number (x) and T-Total (t) on a 9x9 grid 2 3 4 5 6 7 8 9 0 1 2 3 4 5 6 7 8 9 20 21 22 23 24 25 26 27 28 29 30 31 32 33 34 35 36 37 38 39 40 41 42 43 44 45 46 47 48 49 50 51 52 53 54 55 56 57 58 59 60 61 62 63 64 65 66 67 68 69 70 71 72 73 74 75 76 77 78 79 80 81 From this we can see that the first T shape has a T number of 50 (highlighted), and the T-total (t) adds up to 187 (50 + 41 + 31 + 32 + 33). With the second T shape with a T number of 80, the T-total adds up to 337, straight away a trend can be seen of the larger the T number the larger the total. 2 3 4 5 6 7 8 9 0 1 2 3 4 5 6 7 8 9 20 21 22 23 24 25 26 27 28 29 30 31 32 33 34 35 36 37 38 39 40 41 42 43 44 45 46 47 48 49 50 51 52 53 54 55 56 57 58 59 60 61 62 63 64 65 66
T-Total Investigation
Maths GCSE Coursework 2000 - T-Total Introduction In this investigation I aim to find out relationships between grid sizes and T shapes within the relative grids, and state and explain all generalizations I can find, using the T-Number (x) (the number at the bottom of the T-Shape), the grid size (g) to find the T-Total (t) (Total of all number added together in the T-Shape), with different grid sizes, translations, rotations, enlargements and combinations of all of the stated. Relations ships between T-number (x) and T-Total (t) on a 9x9 grid 2 3 4 5 6 7 8 9 0 1 2 3 4 5 6 7 8 9 20 21 22 23 24 25 26 27 28 29 30 31 32 33 34 35 36 37 38 39 40 41 42 43 44 45 46 47 48 49 50 51 52 53 54 55 56 57 58 59 60 61 62 63 64 65 66 67 68 69 70 71 72 73 74 75 76 77 78 79 80 81 From this we can see that the first T shape has a T number of 50 (highlighted), and the T-total (t) adds up to 187 (50 + 41 + 31 + 32 + 33). With the second T shape with a T number of 80, the T-total adds up to 337, straight away a trend can be seen of the larger the T number the larger the total. 2 3 4 5 6 7 8 9 0 1 2 3 4 5 6 7 8 9 20 21 22 23 24 25 26 27 28 29 30 31 32 33 34 35 36 37 38 39 40 41 42 43 44 45 46 47 48 49 50 51 52 53 54 55 56 57 58 59 60 61 62 63 64 65 66