Comparison of SATs results to obtain statistical data on students.
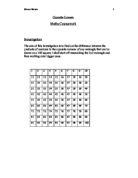
Comparison of SATs results to obtain statistical data on students. Introduction. I have chosen to look at the school's SATs scores for the past three years. I decided to choose this topic as I felt hat it would be interesting to compare the results, also I thought that the topic would give me some good data to work with. I thought that it could be possible to compare scores between sexes, if the scores on average have changed either better or worse. As well, I thought that it would be interesting to see if there is any correlation between subjects and their scores. Data. The data that I am using is past SATs scores from the schools records, over three years. I decided to use three sets of data so I can compare several years of results, this will enable me to get average scores over all three years for both male and female and also an average of all scores, using three years worth of data will also allow me to have more data to work with. I think that the way in which I got my data, which was taking them straight from the school's records, is best because many students would not know/remember their scores; I can receive as much data from each year as I want without much hassle or time wasted. Also this way eliminates the possibility that the data that I received is false, as students may wish to say that they got better or worse scores than they actually did. The data
T-Shapes Coursework
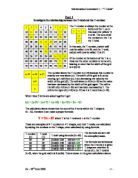
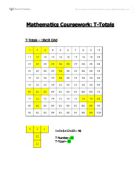
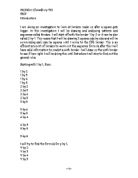
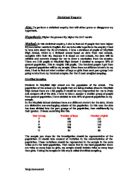
Maths Investigation 2 Higher Tier Task - "T Shapes" I was given a number grid, like Fig 1.1. On it, a "T Shape" was to be placed in any possible position on the grid, such that all of the shape remained within the boundaries. The task was to investigate the patterns connecting the numbers in the "T" themselves, and also patterns in combinations of these numbers. 2 3 4 5 6 7 8 9 0 1 2 3 4 5 6 7 8 9 20 21 22 23 24 25 26 27 28 29 30 31 32 33 34 35 36 37 38 39 40 41 42 43 44 45 46 47 48 49 50 51 52 53 54 55 56 57 58 59 60 61 62 63 64 Fig 1.1 Any number of investigations was possible, but I chose an investigation in which I would add up all the numbers in the "T". Section 1: 3x1 "T" on Width 8 Grid ) Introduction In this section, a 3x1 "T" will be used. This means that there are 3 squares along the top of the "T" (the "wing", in yellow), and 1 on the bottom (the "tail", in green). This is as shown originally in the task brief. 2) Method To discover any patterns, I will calculate the sum of the numbers in the "T" for 5 sequential locations of the box within the grid. As it would be impractical to do all possible calculations, 5 should be enough to display any patterns that may lie therein. The "Middle Number" will be the number in the wing that is adjacent to the tail. It is highlighted in red on Fig 1.1. 3)

Open Box Problem.
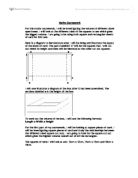
Open Box Problem Aim During this project I will be determine the size of the square cut which makes the volume of the box as large as possible for any given rectangular sheet of card. What is an Open Box An open box is to be made from a sheet of card. Identical squares are cut off the four corners of the card, as shown below. The card is then folded along the dotted lines to make the box. [image001.gif] [image002.gif] Names of things needed for investigation I will write-up my investigation in Microsoft Word and all formulae shall be calculated on Microsoft Excel and all table and graph will be produce in spreadsheets again in Microsoft Excel. Structure of investigation 1. Evidence: · Table · Graphs · Formulas 2. Evaluation 1. Evidence To obtain evidence I will be used a series of methods: · Table · Graphs · Formulae Part 1, Square I am going investigate 3 different sizes for the square open box. Once I have obtained all information on the 3 sizes I will look for patterns and try to formulate a rule to work out the largest volume for an open box square. The sizes that I will be using are: 1. 20 x 20 2. 40 x 40 3. 25 x 25 Because it is a square the length = width so, we can write this as L=1W therefore there is a ratio 1:1. I am going to begin by investigating a square with a side length of 20cm. Using

For this task we were required to create a model that can be used to economise on my quarterly household electricity bill.
Coursework modelling 1B - Write Up For this task we were required to create a model that can be used to economise on my quarterly household electricity bill. My family quarterly electricity bill may be too high. I need to try and devise a method to bring the bill down to an acceptable level. There are lots of aspects of an electricity model that need to be known. Some of the important ones are: * Unit- these are kilowatt-hours, which are the amount of hours an appliance uses multiplied by the kilowatts the appliance has. * Tariff- the rate at which a company charges a unit. * Two-tier tariff- this can also be called a split rate. There are two different costs per unit. There is usually a cost for the first units up to a certain value, sometimes known as a split value, and a different cost per unit for any units after the split value. My bill uses a two-tier tariff. I have named it a split rate model throughout this write - up. * Value added tax (VAT)- this is usually a percentage and is added on to a price. * Standing charge- a value of money that is added onto a price. It is normally a value without percentages, and is added on to a price just for using a supplier. There are many different types of bills. The bills are usually paid quarterly. There is a standard model, which is simply calculated by multiplying the unit amount by the cost per unit. A unit can also
I am doing an investigation to look at borders made up after a square gets bigger.
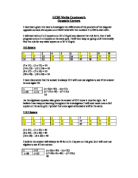
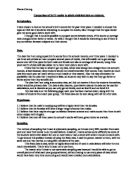
Introduction I am doing an investigation to look at borders made up after a square gets bigger. In this investigation I will be drawing and analyzing patterns and sequences called Borders. I will start off with the border 1 by 2 or it can be also called 2 by 1. This means that I will be drawing 2 squares side by side and will be surrounding each side by squares until I come to the fifth border. This is an efficient amount of borders to work out the sequence formula after this I will have valid information to predict a sixth border. I will draw up the sixth border to see if I am right. I will be doing this until 5x6 where I will stop to find out the general rules. Starting with 1 by 1, then: by 2 by 3 by 4 by 5 2 by 2 2 by 3 2 by 4 2 by 5 3 by 3 3 by 4 3 by 5 4 by 4 4 by 5 5 by 5 5 by 6 I will try to find the formula for y by 1, Y by 2 Y by 3 Y by 4 Y by 5 Also I will find out X by Y. From this I will try to find out how big the border is. Investigating Borders BY 1 5 5 4 5 5 4 3 4 5 5 4 3 2 3 4 5 5 4 3 2 2 3 4 5 5 4 3 2 2 3 4 5 5 4 3 2 2 3 4 5 5 4 3 2 3 4 5 5 4 3 4 5 5 4 5 5 Border Number=B Number of numbered squares=N 4 2 8 3 2 4 6 5 20 Using my table of results I can work out a rule finding the term-to-term rule. With the term-to-term rule I can predict the 6th border. As you
Read All About It
John Saunders (R) Maths coursework: Read all about it In this investigation, I will be comparing magazines and newspapers. I will compare things such as the length of words in articles and the number of articles in them, as you will see in my hypotheses. I will use several different magazines and papers to try and make my final results a little more accurate, and so I can extend on what I can compare, again as you will se in my hypotheses. Papers/magazines I will be using: Newspaper Details Magazine Details Daily Mirror For Thursday June 27th 2002 Shoot Monthly For July 2002 Daily Express For Friday June 21st 2002 What's on TV For 6-12 July 2002 The TV mag* (Supplement from 'The Sun' - for 6th July 2002) F1 Racing For July 2002 *A supplement Calculations: Throughout this piece, I will be using some calculations quite a lot, to work out certain things which are vital in working out whether my hypotheses are correct. These include: ) X = ?fX ? ?f Mean = The total of (frequency x no. of words) ? The total number of words This equation is for working out the mean average of a frequency distribution. It isn't possible to work out the mean using the normal method in a frequency distribution, because the norm doesn't account for all the measures for all the numbers (in other words, no matter what differences there are in the number of letters

Fencing problem.
Problem specification A farmer has exactly 1000 metres of fencing. With this 1000 meter of fencing she wishes to fence off a plot of level land. She is not concerned with the shape of the plot, but must have a perimeter of 1000 m. her requirements are that the fence off the plot of land should contain the maximum area. Plan At the beginning of this experiment I shall begin experimenting with the simplest of all shapes. Triangles shall be investigated first. These triangles shall include equilateral triangle, an isosceles triangle, a right-hand triangle and a scalene triangle. I would find the area and plot the results upon a table. After investigation triangles I shall start with the regular shapes with four sides, a square, rectangles, a trapezium, a parallelogram and a rhombus. Once again areas of these shapes shall be found and recorded on a table. Now I shall continue experimenting different shapes by increasing the number of sides of each shape. These will include: triangles, quadrilaterals, a pentagon, a hexagon, a heptagon, and octagon, a nonagon and a decagon. I would take the whole investigation one step further and experiment with polygons shapes such as letters. For example a polygon shaped as an H, a polygon shaped as an E, and so on. These areas shall also be found and recorded. Finally I shall scrutinize a circle. The results of the area shall also be

Regeneration has had a positive impact on the Sutton Harbour area - its environment, residents and visitors. Discuss
Regeneration has had a positive impact on the Sutton Harbour area - its environment, residents and visitors I am investigating this topic because, as a class, we have studied the inner city areas of MEDC's. We have looked at some of the problems and considered how regeneration may help to solve some of them. Today, about 70% of the UK's population live in the city. This can lead to many problems, such as overcrowding, an increase in health and sanitation problems and much competition between businesses within a city and also between different cities that are trying to attract potential investors into the city. Trying to create a balance between the essential and desirable things in a city is hard to achieve when trying to keep both the residents and the city council happy. This is a problem that the Sutton Harbour area has had to try and overcome by using regeneration to make the place more attractive to businesses and tourists to help the council have a higher income, but also to suit the current residents. I will look at just how successful the regeneration of Sutton Harbour has been and find out the views of the people that have to live their, and why tourists were attracted to the area. Key Concepts Definitions Urban decay A region or building in a built up area that is of a poorer quality and condition to that of the surrounding area. Inner city The older
Mayfield High School
Statistics Coursework - Higher Tier Introduction This is a Statistics Coursework which is based upon Mayfield High School. I have predicted three hypotheses from which I must decide whether they are true or false. Hypotheses Hypothesis 1: Males are taller than females My first hypothesis is that the male students on average will be taller than the female students. I believe this because in general males grow taller than females and grow until a later age, e.g. most males continue to grow until they are 21, whereas most females only grow until they are 18. The data that is required to test this Hypothesis is the heights of all years from 7-11 of both male and female students that attend Mayfield High School. This means that I will be using secondary data. I will first investigate this hypothesis by deciding whether my distribution is normal or skewed. I will use Grouped Frequency tables, Estimated Mean tables, Estimated Standard Deviation tables, Histograms and Box and Whisker plots to test this data. Hypothesis 2: The taller you are the heavier you are My second hypothesis is that the taller you are the heavier you are. I believe this because in general the taller in height you are the more body mass you will have and usually you will weigh more than people that are smaller than you. For this hypothesis I will use the same given data but instead of just using
Perform a statistical enquiry that will either prove or disapprove my hypothesis.
Statistical Enquiry Aim: To perform a statistical enquiry that will either prove or disapprove my hypothesis. Hypothesis: Higher the persons IQ, higher the SAT results Method: In this statistical enquiry, I aim to find out if people that have higher IQ have better results in English. For me to be able to perform the enquiry I had to have data about the IQ of students. I have a database of pupils of Mayfield High School, which is a fictional school based on data from real schools, complete with their IQ. Because it is based on real schools, the data will be reliable and accurate enough for me to draw a conclusion from the enquiry. There are 1183 pupils at Mayfield High School- I decided to compare 10% of general population. This is roughly 100 pupils. The hundred people I get from the general population will be my sample. Since there are different strata's in my data, I had to find out what number of boys or girls from each year group I am going to take from my hundred samples. For that I used stratified sampling. Stratified Sampling Students in Mayfield high school are the population of the school. The population of the school are the pupils that are being studied. Since in Mayfield High School there are 1183 pupils, it would be very impractical for me to study and compare all of the data. I have to take a sample- a smaller group of people from general population. I