I have decided to use this method because it is safe; it gives me a good range of results and is reliable as is possible in a school laboratory.
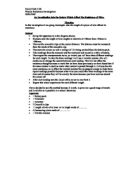
Apparatus
- 1 Battery pack
- 1 Voltmeter
- 1 Ammeter
- 2 Crocodile clips
- 1 Length of wire of at least 1m in length made of eureka
- 4 Connecting wires made of copper
- 1 Variable resistor
Diagram
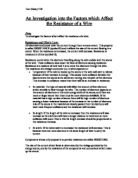
Fair Test
To make this investigation as fair as possible I am going to take the following precautions.
- Turn off the circuit after each reading to prevent the circuit from overheating as we know that temperature has an affect on resistance
- If the investigation takes place over more than one lesson try and use the same equipment because even if it appears the same they may differ. So try and complete this investigation in one lesson
- We must, for ease of measurement and to try and keep everything the same secure the wire to the table or any other non-electrical conducting solid surface, this is to try and prevent the wire from bending as we do not know if this would affect the resistance.
Safe Test
To make this investigation as safe as possible I am going to take the following precautions.
- The wire is going to get hot during the investigation so to prevent burns I will turn the circuit off between each reading.
- The wire is going to be fairly light and sharp at both ends and because of this if and end is loose I the air people may not be able to see it easily so I will quickly secure it to a surface to protect people from possible injury, especially their eyes.
My Results
During this experiment I am going to fill in the following results table. This shows the range of results that I hope to collect and it also shows the formulas that will be used to find the averages.
I have chosen to use this range results for many reasons: -
- If the length of wire is shorter than 100mm the wire will burn out.
- A length of 1000mm is sufficient for this investigation but if required at a later date if could be extended.
- I think that three repeats is also sufficient for this investigation.
Prediction
I think that as the length of the wire increases so to will the resistance of it. I also believe that the rate at which the resistance of the wire increases will be directly proportional to the length. My reasoning for this is that with electricity, the property that transforms electrical energy into heat energy, in opposing electrical current, is resistance. A property of the atoms of all conductors is that they have free electrons in the outer shell of their structure.
As a result of the structure of all conductive atoms, the outer electrons are able to move about freely even in a solid. When there is a potential difference across a conductive material all of the free electrons arrange themselves in lines moving in the same direction. This forms an electrical current. Resistance is encountered when the charged particles that make up the current collide with other fixed particles in the material. As the resistance of a material increases so to must the force required to drive the same amount of current. In fact resistance, in ohms (Ω) is equal to the electromotive force or potential difference, in volts (V) divided by the current, in amps (I) – Ohm´s law. As the length of the wire is increased the number of collisions the current carrying charged particles make with fixed particles also increases and therefore the value for the resistance of the wire becomes higher. The material and cross sectional area of the wire is constant throughout the experiment. Therefore it is clear from the formula that the resistance should be directly proportional to the length.
Obtaining Evidence
To obtain these results I have used the experiment as laid out in my plan.
The first three columns of my table show how I obtained the length of my piece of wire as fairly and accurately as possible. I did not start at 0mm I started at 100mm as this meant that there was no possibility of this not being exactly 100mm. So 100mm became my 0 mm.
I also measured this distance from between the inside edge of the two crocodile clips as shown in my diagram.
Analysis
Trends
From the graph we can see one very clear trend, which is, as the length of the wire increases so does the resistance of it. This is shown by the positive correlation of my graph. Another, more significant thing is that it the increase is constant. This is indicating by the fact that the line drawn is a straight one.
Conclusion
In my prediction, I stated that:
If the length increases than the resistance will also increase in direct proportion to the length.
From my graph, I can see that the resistance of the wire is directly proportional to the length of the wire. I know this because the Line of Best Fit is a straight line through the origin showing that if the length of the wire is increased then the resistance of the wire will also increase in proportion to each other. The line of best fit is a straight and it goes though (0,0) if there is no length, there is no resistance proving that the resistance of the wire is directly proportional to the length of the wire. This proves my prediction right. I can work out the gradient of this line by dividing the Resistance by the length. So, 1.75/55=0.0318.
The length of the wire affects the resistance of the wire because the number of atoms in the wire increases or decreases as the length of the wire increases or decreases in proportion.
The resistance of a wire depends on the number of collisions the electrons have with the atoms of the material, so if there is a larger number of atoms there will be a larger number of collisions that will increase the resistance of the wire. If a length of a wire contains a certain number of atoms when that length is increased, the number of atoms will also increase.
If the wire is half the length of a certain wire, it would have has half the number of atoms, this means that the electrons will collide with the atoms half the amount of times. In addition, if the length of the wire was trebled or quadrupled, then the resistance would also treble or quadruple. This is indicated on my graph, with the length being 100cm and the resistance being 6.56 Ohms. This in theory would mean that at 50cm there would be a resistance of 3.24 Ohms. From the graph it is easy to tell that the theory is correct and therefore my results reliable. From my results table and graph, I can see that my results that I collected are quite reliable and accurate. I know this because my results table shows a few, individual anomalous results; the anomalous results are at lengths 600mm and 900mm. All the other points are extremely close to the line indicating that my results are accurate.
I think that my results are suitable to confirm my prediction and support a conclusion.
Graph 1
Graph 2
Graph 3
Graph 4
Graph 5
Evaluation
In the Analysis and the graph I have shown two main anomalous points, this means that there must have been a slight error in my experiment. As the wire, length is bigger at these points I found it harder to stretch it out and consequently, measure it accurately. Although the graph is overall accurate and the results precise it is easy to see, the anomalous averages plotted because they do not all lie along the same best-fit line. The graph shows that my results are reliable as there are only two main anomalous points, (which are easily accounted for) to improve the reliability of my results, I could do more repeats in doing this my average would be more reliable.
As I increased the wire length, the wire became hotter and gave off heat. This could explain why the anomalous results are at the top of my graph, 900mm and 600mm. I think one of the reasons why my experiment is quite accurate is because I tried to measure the wire as accurately as possible. The metre rule was taped onto the workbench. The wire was stretched until it was nearly in a straight line so a bit was overlapping at each end. As the metre rule was curved and worn down at the corners it was slightly hard to see where 0cm was. Finally, the inside edge of the crocodile clips were placed at the appropriate point. I still however would like to make the measuring more accurate.
During my experiment, I have noticed several modifications I could make to improve on the Investigation if I was to repeat it.
To improve on my results I could use a new or higher quality digital voltmeter. The next modification I would make would be to use pointers instead of crocodile clips to attach to the wire; I would do this because pointers would be more accurate. The pointers would be more accurate because the tips have a much smaller area than the crocodile clips giving a more accurate measurement of the length of wire. I would also use a newer metre rule. The graph shows that my results are reliable as there are only two anomalous points, to improve the reliability of my results, I could also have repeated the same lengths of wire more times. Although the wire is an E26 wire, the thickness of it may vary by a small amount and maybe helping to cause the anomalous results. Sometimes the ammeters flicked between a decimal point, I maybe could have thought it was the wrong number and therefore would have ended up with the wrong average resistance. In the experiment, I did not control the room temperature but instead just assumed it was keep constant throughout my experiment; this could have made the wire get hotter and therefore making my experiment not as accurate. In future experiments I would control this variable factor and make it a constant factor. I would do this, as it would be an unfair test if there were two known variables.
As well as making these modifications, I could also expand on my investigation by testing the same wire but different widths of that wire. I would do this if I had more time to complete it. I think the circuit and method used was quite suitable although I would make the modifications above to improve my results. If I did this experiment again I would defiantly use top quality equipment, I would probably control the temperature and use pointers instead of crocodile clips. After changing those few things, there is not really much difference to how I would do the experiment again.