Why does the colour leak out of cooked beetroot
Why does the colour leak out of cooked beetroot? Purpose of the Experiment * To investigate the effect of temperature on membrane structure. Hypothesis I predict that as the temperature of the water in which the beet root is placed in is increased, the amount of pigment leaked will increase i.e. the solution will become darker in colour. My prediction is based on the concept that cell membranes will breakdown if the temperature rises. Membranes are made of a bilayer of phospholipids and protein molecules. The key aspect to notice here is that the cell membrane is made of proteins, which are made up of chains of amino acids. The linking of amino acids is strong in a protein, however the three dimensional shape of the protein is determined via hydrogen bonds which are relatively weak and can be broken by heat and chemicals. Once the hydrogen bonds are broken the protein can no longer function correctly, as is the case in the cell membrane. I believe as the heat rises the proteins that make up the permeable cell membrane will break down and the betalain pigment in the beetroot cells will leak out. The stronger the heat, the more the proteins will denature and more betalain will leak out. Method and Materials To carry out this experiment we used: • Raw beetroot • Size 4 cork borer • White tile • Knife • Ruler • Water baths at 0, 10, 20, 30, 40, 50,
Why does the colour leak out of cooked beetroot
Why does the colour leak out of cooked beetroot? Aim The aim of this practical is to use beetroot to examine the effect of temperature on membrane structure. I will be testing what effect the independent variable has on the dependent variable. Independent variable: The independent variable is the temperature of the water that the beetroot with be tested in. the temperatures I will be testing will range from 10 to 70 degrees using thermostatically controlled water baths. Dependent variable: The dependent variable will be how much water is left after a trial in a specific water bath. This will be calculated using a colorimeter which measures how much of the beetroot dye has leaked out of its cells. Prediction I predict that as the temperature increases, so will the colour of the beetroot. I predict this because of the knowledge I have on membrane structures. The red colour you see in beetroot, is a red dye that comes from pigments present in the beetroot called betalains, which are present in the cell vacuole. When beetroot is cooked, the temperature causes the pigments to leak through the cell membranes, which would not happen if it was not cooked. This happens because the increase in temperature damages the cell membrane, which causes the cytoplasm and other substances to leak out. This knowledge can help me predict that the higher the temperature, the more pigment will

Biology Coursework : Rate of Photosynthesis
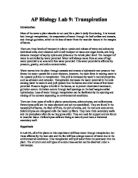
Biology Coursework : Rate of Photosynthesis Aim To investigate a factor that affects the rate of photosynthesis. Outline A piece of pond weed will be cut and placed into a beaker containing water and sodium hydrogen carbonate. A lamp will be shined on to the pond weed and the amount of bubbles released from the plant will be counted for 1 minute. The lamp will be adjusted to different distances from the plant to try and obtain different results. Background In Previous experiments leading up to this one, we have seen that plants are able to photosynthesis better when there is plenty of light. As long as there are no other limiting factors this should be true. When chlorophyll absorbs light energy, the light energy cannot be immediately used for energy conversion. Instead the light energy is transferred to a special protein environment where energy conversion occurs. This happens by using the energy of a photon to transfer electrons from a chlorophyll pigment to the next. When enough light energy has been harnessed at a reaction centre, ATP can be synthesized from ADP. During this reaction, oxygen is produced as a by-product and it is the oxygen bubbles that are being measured in the experiment. The greater the light intensity, the more light energy that can be transferred and harnessed to fuel reaction in photosynthesis. Diagram Photosynthesis Equation: 6CO2 + 6H2O
Photosynthesis Simulation
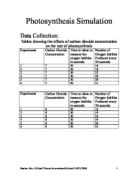
Photosynthesis Simulation Data Collection: Tables showing the effects of carbon dioxide concentration on the rate of photosynthesis Experiments Carbon Dioxide Concentration Time to taken to measure the oxygen bubbles in seconds Number of Oxygen bubbles Produced every 30 seconds 7 30 6 2 7 30 8 3 7 30 23 4 7 30 29 5 7 30 30 6 7 30 31 Experiments Carbon Dioxide Concentration Time to taken to measure the oxygen bubbles in seconds Number of Oxygen bubbles Produced every 30 seconds 8 30 6 2 8 30 9 3 8 30 24 4 8 30 24 5 8 30 30 6 8 30 32 Experiments Carbon Dioxide Concentration Time to taken to measure the oxygen bubbles in seconds Number of Oxygen bubbles Produced every 30 seconds 9 30 20 2 9 30 22 3 9 30 26 4 9 30 30 5 9 30 33 6 9 30 34 Experiments Carbon Dioxide Concentration Time to taken to measure the oxygen bubbles in seconds Number of Oxygen bubbles Produced every 30 seconds 0 30 21 2 0 30 23 3 0 30 26 4 0 30 27 5 0 30 31 6 0 30 32 Variables: Independent: in this investigation two factors will be changes, carbon dioxide concentration and light intensity. Dependent: the number of oxygen bubbles produced. Controlled: * The Color of the light will always be the same (white). * The time taken to measure the bubble production will be the same (30 seconds).
an evaluation of the impact of glaciation on human activity
An evaluation of the impact of glaciation on human activity Introduction: In this essay I will talk about the impact of glaciation on human activity and whether this is a negative effect or a positive effect. I will explain why it is positive or a negative effect by using some examples such as ,hydro electric power plants (hep) (fig 1) tourism, transport on valley glaciers, the impact on water sources and farming in east Anglia. Some of the areas I will talk about that have had the impact of glaciation on their human activity will be the fox glacier village in New Zealand, the sima hep plant in Norway (fig 2). Research and examples and explanation: Sima hep plant has both positive and negative effects from the glaciation the first one I will say is a positive. This positive is tourism. Tourism has been improved since the hep plant has been built because the biggest tourist attraction in the area is the Vøringsfossen water fall. The development of Sima has affected the flow of water that flows to the falls. In the summer the discharge of water was 12 meters per second so it is a spectacular site. This second example is a negative. This negative is to do with the increasing and improved roads that had to be built. The transport rout have been increased and improved because when Sima was being built you can't just have one single road you have to have lots of roads
Osmosis in potato and apple
Investigating The Effect Of Osmosis On Two Different Plant Tissues The aim of the investigation is to find out the effect water potential has on osmosis in two different plant tissue; apple and potato. To help me on this investigation I decided to conduct a preliminary experiment. This allowed me to have an overall impression of the experiment, and I could spot any weaknesses in my experiment which I can modify to ensure that the real experiment has no flaws, so that the result obtained are accurate and reliable. The preliminary experiment involved cutting five 'chips' of each tissue sample, to equal size, and placing each into different concentrations of salt solutions. After an hour, the samples were taken out of the solution and measured. The results and graph are in appendix 1. Possible variables There are a number of factors I shall be keeping the same: Temperature: the temperature must be kept constant throughout the experiment as it may affect the results, and the movement of water molecules. 2 Volume of salt solution: the volume must be kept the same; in this experiment, each 'chip' will be immersed in 40ml of salt solution. 3 Initial volume of plant tissue 'chips': this will be kept the same using a core borer. 4 Initial length of plant tissue 'chips': this will be cut to 50mm 5 Initial mass of 'chips': this is difficult to control, however each 'chip' will

Investigate which surface of a leaf loses more water by transpiration.
PLAN SECTION 1 An investigation into which surface of a leaf transpires more by transpiration. Brief statement of investigation I am going to investigate which surface of a leaf loses more water by transpiration. I will do this by covering certain sides in a layer of Vaseline. The Vaseline will prevent transpiration occurring on that particular side allowing me to see which side transpires more. Risk assessment The number of risks in this assessment is minimal but the following risks will be present: * Any leaves must not be consumed * Extreme care must be taken when handling glass Vaseline pots * Paper clips must be handled with care and must not be uncoiled * All personal property should be tucked away while the experiment is being carried out Independent variable The surface(s) covered by Vaseline i.e. topside or underside. Dependent variable The amount of transpiration that occurs from a particular surface and therefore the amount of weight lost due to transpiration from one particular surface. Number and range of readings I will be making one reading for each leaf after about 20 hours. SECTION 2 Prediction I predict that the underside of the leaf will transpire more. I also predict that the amount of transpiration that occurs from the two leaves with one surface vaselined will be roughly the same as the amount that occurs from the leaf with neither of

An experiment to measure the amount of oxygen bubbles given off in different strengths of sodium hydrogen carbonate
An experiment to measure the amount of oxygen bubbles given off in different strengths of sodium hydrogen carbonate Equipment list * Lamp * Beaker * Boiling tube * Pond weed * Ruler * scissors * Water * Measuring cylinder * Different strengths of NaHCO3 * Paper clip * Stop clock Plan In the experiment I will get a piece of pond weed and cut it to 5cm I will then make sure that the hole is clear and the leaves from that end have been removed so that oxygen bubbles will be able to escape and not get trapped. Once I have done this I will attach a paper clip to the other end to keep the piece of weed in water or the solution. I will then get a beaker and put 200ml of water and into it. After this I would place the boiling tube with 40ml of water and the pond weed into it and turn on the lamp that will be put 20cm away from the beaker and leave for 3minutes so that the weed can get used to the water. Once these 3 minutes are over I will be taking readings on how many bubbles come out of the weed every 30 seconds and I will be taking ten readings. After I have took all these reading I will do the same again. But instead of the piece of pond weed being in water in will now be in 0.25% NaHCO3 and I will do the same leave it for 3 minutes so that the weed can get used to the solution and then I will start taking readings. I will take ten readings one every 30 seconds
An investigation to show the effects of changing the concentration of hydrogen peroxide on the rate of catalyst
An investigation to show the effect of changing the concentration of hydrogen peroxide on the reaction rate of catalyst. Title of investigation An investigation to show how the concentration of substrate affects the reactivity of hydrogen peroxide. Theory behind experiment The theory behind the experiment is to evaluate how our human bodies react with enzymes. They can be found in food products such as apple, yeast, liver. We used these products in our first preliminary experiment to see which ones would be most reliable for our further investigation. Prediction I predict that the results of this experiment will show that the higher the concentration of the hydrogen peroxide, the more gas will be produced from the reaction. This is because at higher concentration there are more molecules in the hydrogen peroxide, and there being more molecules in the substance means that the molecules are much more likely to collide. So the higher the concentration of the hydrogen peroxide the more gas will be given off, 20% concentration of hydrogen peroxide will give off the most gas and 5% concentration of hydrogen peroxide will give off the least gas is what I predict. An investigation to show the effect of changing the concentration of hydrogen peroxide on the reaction rate of catalyst. Aim The aim of my investigation is to find out if changing the concentration of substrate
Photosynthesis and Limiting Factors
AT1: Photosynthesis and Limiting Factors Aim: In this experiment, I will test to see how heat affects the rate of photosynthesis in a water plant as a limiting factor. Background Knowledge: Photosynthesis is the process by which chlorophyll containing organisms, (namely green plants, algae, and some bacteria), capture energy in the form of light and convert it to chemical energy. Virtually all the energy available for life in the earth's biosphere, (the zone in which life can exist), is made available through photosynthesis. A generalized chemical equation for photosynthesis is: Carbon Dioxide + Water + light energy = Sugar (Glucose) + Oxygen + Water This can be seen as two different chains of reactions... One involves the transfer of light energy into chemical energy that is light intensity dependant - if it is lighter the reaction happens more efficiently. The other shows the creation of glucose and is heat dependant. The glucose is created by carbon dioxide and water, and the reaction is powered by the chemical energy converted from solar energy. The carbon dioxide must be broken down using enzymes to form the basics of the glucose. This is heat dependant because enzymes work better at higher temperatures. This creates glucose (C6H12O6) and waste products, oxygen (O2) and a little water (H2O). Artificial Photosynthesis If chemists were able to duplicate