Cross-sectional area of the wire
A thin wire has a greater resistance than a thick wire. This is because it is harder for the current to flow down a thin wire as the electrons cannot flow fluently. However if the wire is wider, it is far easier for the current to flow.
Material of the wire
Some materials are better conductors than others for a number of reasons. They may have a larger number of free electrons per volume than other materials. These free electrons are available to carry current when a potential difference is applied to the ends of the wire. In addition, the size and closeness of the remaining ions may contribute to conductivity. Metals such as copper are very good conductors and will have a low resistance. The measure of a material’s resistance for a given length and thickness is its resistivity (ρ). The units of resistivity are Ωm.
Prediction
I predict that doubling the length of the wire will double the number of collisions an electron has with the ions. Therefore, the resistance is doubled. A graph of resistance versus length should be a straight line through the origin.
Plan
In this investigation, the length of the wire will be varied and the resistance measured for various lengths. The reason that length has been chosen as the variable is because it is a continuous variable and can take many different values. The other variables, cross-sectional area and the material of the wire, must be kept constant in order to ensure a fair test. The temperature of the wire should also be kept constant or Ohm’s Law cannot be applied. Temperature increases can be kept to a minimum by switching off the supply between readings. The type of wire and its thickness needs to be chosen so that currents are low (to avoid overheating). The range of lengths chosen also needs to be suitable for low currents, given a 4V d.c supply.
Range
Preliminary readings can confirm a suitable range of lengths. To improve accuracy, 3 measurements of resistance for each length will be made by using a variable resistor in the circuit. In order to construct a good graph the results of at least 8 different lengths should be used.
Equipment
Ammeter (accurate to 2d.p. or ±0.005A), 2 Crocodile clips, Meter rule, Power pack, Voltmeter, Switch, Wire (varied in length)
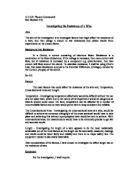
Circuit diagram
Conclusion
From the results of this investigation, it is proven that the resistance of wire increases, or becomes greater, when the length of the wire is increased and no other variable is changed at the same time.
Evaluation
There are a few things that could have affected the results, and perhaps given false results, during this experiment. For example, if one of the group cut the wire too short or too long, this would not give the correct result for say 80cm. Also, if someone misread a result and recorded it under the wrong measurement, that would affect the graph. If the wire was bent this would affect its resistance.
All these factors could have potentially made the results void.