I will put my results for cross sectional area in a table like this:
I intend to repeat each experiment three times to get an average result, which will help me cancel out any anomalous results, and give a more accurate final reading. I will collect results from 5 different standard wire gauges. I will measure the resistance that is in the connecting wires each time I do an experiment, and take that number away from my reading, to give me a more accurate result.
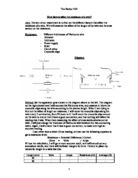
Preliminary Investigation: I did a preliminary investigation to help me understand what would happen, and help me solve any problems early before I took my final results. I set up my equipment as shown in the diagram, and took these results. For these experiments, I only took a direct Ohms reading, instead of doing a calculation.
These are the results that I got. None of them stand out as anomalous on the graph, and it is easy to see a trend. The longer the wire, the higher the resistance is. I did this experiment with a wire that has a 0.095 mm² cross sectional area (CSA) or a 30 SWG (Standard Wire Gauge) rating.
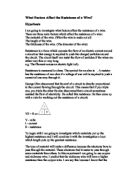
These are the results for a wire with a 30 SWG rating. This is the rating for the cross-sectional area of the wire. You can work out the cross-sectional area for the wire by using the following equation:
Area = ∏ (diameter / 2) ².
From my preliminary experiments I have noticed that the larger the cross-sectional area the lower the resistance. I have also noticed that the longer the wire is, the higher the resistance will be.
Variables: I am going to change the length of the wire each time I take a result for the first experiment. For the second experiment, I will take a set of results with one thickness of wire, and then another with a different thickness. I will not change the current that I am sending through the wire, as this would give me unfair results. I will not change the type of wire that I am using because different wires have different levels of resistance.
Prediction: From my preliminary results, I can see that as the length increases, so does the resistance. The graphs clearly show a pattern between length and resistance. I predict this will happen when I take my final set of results. I can also see from the results, that the larger the cross sectional area of the wire, the higher the resistance will be. The reason for this is that all conductors have free electrons in the outer shell of their structure. This means that these can move, and carry a current around a circuit. Resistance occurs when these charged particles collide with fixed ones. This will obviously occur more if there is a longer distance that these charged particle must travel, therefore using up more energy. Also, in a wire with a larger cross sectional area, there is more room in which the particles can travel, as shown in the diagram below.
Results: Affect of length on resistance.
Affect of cross sectional area on resistance:
Analysis and conclusion:
I have found out that, if you increase the length of the Nichrome wire in a circuit, the resistance increases. My table of result shows this, and so does the graph above. I can clearly see a pattern between length and resistance, and the line of best fit shows that they are directly proportional.
The second graph shows that cross sectional area affects the resistance in a wire. If you increase the cross sectional area, then the resistance of the wire increases. This is because of the electron flow, where in a larger wire, there is more space for the electrons to flow, so there is less resistance. Also, in a wire that is longer, there are more collisions between mobile particles carrying a charge and fixed ones, which increases the resistance.
My prediction was right because I predicted, using my preliminary results, that the longer the wire the higher the resistance would be, and the larger the cross sectional area the higher the resistance would be. These graphs prove that my prediction was right. I think my prediction was reasonable, as I based it on my preliminary results, and the results above prove it was right.
Evaluation: I think in general that my results are of a sufficient quality to be reliable. None of my results stand out as being anomalous, although several do not fit the pattern as closely as others. For example, my average reading for 30 centimetres for the experiment on length stands out slightly more than the rest, as can be seen in the graph. This could be for a number of reasons. It could be because the current being sent through the circuit was accidentally changed, which would have had an affect on the reading. Also, the crocodile clips could have not been making a clean connection on the Nichrome wire, due to rust or something similar.
If I wanted to make my results more accurate, I could repeat the experiments more times, to get an average which took into account more readings, and would therefore be more accurate. I could also take a larger range of results; say from 100 centimetres down to 0, instead of 50 down to 0. I could also do the same for cross sectional area, by taking more readings from more thicknesses of wire. This again, would give me a larger range of results.
In general, due to the fact that there are so few of my results that do not fit the pattern, I think they are reliable enough to make a firm conclusion on the affect of length and cross sectional area on resistance.