Geographical Theory and Key Terms
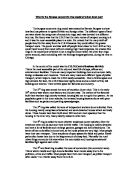
Burgess Concentric Ring Model
KEY
CHARECTERISTICS OF;
CBD
The Central Business District is the pulse of the city. This zone is the most accessible to the most amount of people, containing high order shops, head offices, banks etc. Land is expensive and this area has high rents and multi-storey buildings as a consequence. There is very little space and competition for land is high. There is also a high amount of traffic congestion and there is a lack of open space. It is also the centre of culture and entertainment containing theatres, restaurants, cinemas, clubs and museums. Transport routes converge in the CBD making it the most accessible part of the city. Finally it is also popular for being the centre of government whether it being local or national, for example Albert Square in the City Hall of Manchester.
INNER CITY
This area started to develop as zoned industry in the late 18th and19th century. Its main land use was industry and farming as it was built during the Industrial Revolution. Also it is a zone of low cost/high density housing which is more formally known as `terraced housing’. In the 20th century factories have now closed down, declined or cleared and have left brownfield sites. Many modern factories have relocated to greenfield sites at the rural urban fringe. This is sometimes called the `twilight zone’. Nineteenth century buildings are arranged in grid patterns and have no gardens, the poorest people in the settlement live here and unemployment is very high.
INNER SUBURBS
This is a zone of semi-detached housing (medium density/medium class) with gardens on large estates. It was built between both WW1 and WW2 and is known by the name `inter-war years’ (1920s and 1930s). There are areas of open space, parks for people’s leisure. Also the land use is public buildings for schools which are nearby the houses. The commercial land use is small corner shops nearby the houses. Transport is also an important land use because people had to commute to work outside the suburbs.
OUTER SUBURBS
This zone was developed after 1945. This is a high class residential area where private, top quality housing can be found. Detached housing (high class/high cost/low density) can be built on cheaper land here and there are often lots of garages. Big gardens and many outbuildings can be found here. Roads are also tree lined. It is called the 'commuter zone' as it is expected that the more affluent members of the community would live in the zone furthest away from the centre as they could afford the transport costs to the centre for access to services and employment.
RURAL-URBAN FRINGE
This is at the edge of the city, it is where the city meets the countryside. This area is under threat-URBAN SPRAWL. Cities are growing outwards using up more land, for example, Trafford Centre, Cheadle Royal, Handforth Dean, shopping centres etc. Modern industries are relocating to greenfield sites because they want access to motorways. Transport routes have grown for example, Manchester now has a motorway around the city.
A Transect of the Burgess Model
Geographical Terms
Land Use Patterns
All cities (urban areas) have a commercial pattern of land use. The centre of the city is used for commercial land use and is always the most accessible. The zone of industrial land us is found in the inner city or the rural –urban fringe, on greenfield sites. Nineteenth century industry was found near canals or railways however in the twentieth and twenty-first centuries they are mainly found near motorways.
Residential areas consist of different housing in different parts of the city. In the inner city there is mostly terraced housing for factory workers. In the Suburbs there is a mix of semi-detached and detached housing with front and back gardens etc. (see notes on Pg 14)
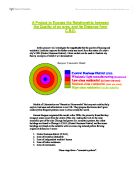
Land Values
Urban Distance Delay
HIGHEST
LAND VALUE
Land Value
VALUE OF HOUSES
LOWEST
CBD INNER CITY SUBURBS R - U FRINGE
Distance Km
The Land Value is highest in the CBD, however as the distance increases towards the R-U Fringe the land value decreases. The value of houses in the CBD is high however as the distance increases to the Inner City it decreases dramatically. Also as the distance increases even further upto the R-U Fringe house value starts to increase again. This causes house value to be highest in the R-U Fringe.
Residential Areas
In all cities, they have different residential areas, for example Terrace, Semi-detached and Detached. (see notes on Pg 14)
Environmental Quality
The Central Business District is probably the most poorest in environmental quality out of the city, this is because there is very little space and it consists mainly of high order shops, head offices, banks etc. These result in lots of pollution and traffic congestion. Pollution comes from cars giving off carbon monoxide and the huge companies burning fuels and getting the energy from those fuels to run the place etc.
The Inner City is also quite poor again as also there is a lack of space there and it is where most of the industry takes place, so they are giving off pollution most of the time. There is also a lot of low cost/high density housing which results in a lot of congestion. The suburbs is where it gets better, this is because there is open space, with lots of parks and trees so there is a lot of fresh clean air. There probably is a bit of pollution coming from cars and houses but there isn’t as much pollution and congestion as there is coming from the other two zones. In the Rural - Urban Fringe it is very pleasant and quiet without hardly any pollution at all. This is because it is the countryside and there is a lot of open space and not a lot of buildings. However companies have now started to move into this zone and it is under threat from becoming like the other areas of the city.
Industrial Location
There was a lot of Industry in the late 18th to early 19th Century. In places like Ardwick there were a lot of factories. However, in the 20th Century there was a rapid decline if industry. This meant that factories had to move some place else. When these factories had shut down they left behind, what we call Brownfield sites. New industries, instead of going back to the Brownfield sites have located to the R-U Fringe. These are known as Greenfield sites. An example of this is the Siemens Factory which is placed in Chorlton.
Shopping Trends
Fifty years ago people shopped locally (corner shops) on a daily basis. The reason being that they never had the facilities that we have today, for example; there was a lack of fridges and freezers, this meant that they couldn’t store food over a period of time without it being expired. There were no supermarkets then like we have today so they had to shop at their own local shop, and finally there was a lack of transport so they couldn’t go somewhere far to do their shopping. Today people are out shopping in their cars weekly, fortnightly, even monthly. This is because they are able to store their food in fridges and freezers. Most of the corner shops have now closed and there is a rapid growth of supermarkets which are open 24 hours a day and let people shop at any time they want. People nowadays are also prepared to travel to long distances just to shop, for e.g. New York, France, Italy etc. Also local shops are going into decline because they cannot compete with the supermarkets. The growth of out of town shopping centres is also increasing for example The Trafford Centre. The bonus that comes with all these centres and markets is that the land is cheap so there is a lot of space for car parking etc.
Traffic Issues in Cities
There is a rapid growth of traffic and congestion which is developed mainly because of cars. In the 19th Century people walked. In the early 20th Century people used bikes, trams and eventually buses for their transport. However in the late 20th Century there is a dominance of cars which are causing pollution and congestion. One solution to this is to introduce a congestion charge. In London congestion charges are being put into place and there may be a charge of £10 or £25. Alternatives to cars are public transport for example, buses and trams etc. If more people were to do this there would be a cut down in traffic congestion and pollution and then cities would be much cleaner and happier places to live in.
Methodology
(How I completed my Coursework- the methods I used. All outlined Step by Step)
Step 1
In class we discussed land use models, in particular the Burgess Concentric Ring Model of Urban Land Use. From that we came up the hypothesis for our coursework.
Step 2
Having come up with a hypothesis we needed to test it. We did this by using the three generalisations.
Generalisation 1
- It is possible to identify Burnage as part of the inner-suburbs of Manchester.
Generalisation 2
- It is possible to identify different types of land use in Burnage, but the main land use should be residential if Burnage is a suburb.
Generalisation 3
- Residential areas vary in terms of housing quality, house price and environmental quality as you move away from the Central Business District (CBD).
Step 3
We then wrote out our Introduction and I typed it up
Step 4
We discussed in detail the Burgess Concentric Ring Model of Urban Land Use and the Geographical key terms and we also wrote them out neatly. I hen typed them up
Step 5
We discussed and wrote up notes on the history and location of Burange. I then got some from the internet. These consisted of a ward map, map of Manchester, map of North-West and a map of Great Britain.
Step 6
We discussed and wrote out the expectations that we would gain from all the generalisations. I then typed these up.
Step 7
Our teacher handed out maps of the Burnage area. We decided on the boundaries of the area we would survey.
The boundaries were:
- Green End Road South.
- Kingsway, West.
- Albert Road, North.
- Errwood Road, East.
Step 8
We discussed in class and decided on keys for our survey.
Land Use Key
Housing Key
Environmental Survey Key
Step 9
As a class we went out of the classroom to collect data. I worked as a group, in a team and collected some data on my own. My teacher also came out to supervise us, as we surveyed the area around the school. I also surveyed a small area on my own.
Step 10
As well this we all had to some Independent Research which included taking an environmental survey test of 5 streets located next to my house and then we had to compare the results with the environmental survey that took place with everybody’s contributions.
Step 11
As we came back into the class, we compared and collated out the data.
Step 12
We presented the data in a series of graphs and map form. We used the Land Use Map. Firstly I coloured the map in according to the codes. I then stuck a piece of squared graph paper and stuck it over the top of the map. I then filled the grid in like so:
After filling in the grid, I drew up a table and put in the values. Having filled in my table I received totals for the different land uses and counted up a total.
I then worked out the percent figures and drew up a bar graph and a pie chart on the computer. I worked out the percentages like so:
Step 13
Data interpretation
Having presented the data I then analysed and gave valid conclusions of my results.
Step 14
Having completed my coursework by working in the classroom, doing work on my own, annotating maps and photos, giving my expectations on the generalisations and analysing them did an overall conclusion. This meant to look at all my results and relate back to the original aims.
Step 15
I did an Evaluation of my coursework at the end, where I looked at, where my coursework was good, where it was bad and what I did to improve my coursework.
Generalisation 1
Gen 1 : It is possible to identify Burnage as part of the inner suburbs of Manchester.
Expectations
Before I do my investigation I think that I am going to find Burnage is part of the inner suburbs of Manchester. My reasons for believing this are from my historical maps I can see that Burnage developed in the inter-war period. So according to this Burnage has inter-war housing.
Also other evidence is my visual evidence. I live in the area of study which is Burnage. I also attend Burnage High School. From this I can see that everyday when I walk to school see may land uses. Not only to school but when I go out I also see evidence which supports my expectation. The houses that I normally see are mixed between council and private; however the type of housing is mainly semi-detached. I also see here in Burnage that there is many open fields for example the school fields. Other types of land uses that I see are commercial and transport.
The type of housing is much earlier here and that’s what I expect to find because older housing would be closer to the CBD as that was the centre of development for the area. However as you move away you get into the suburbs and here the housing is much newer. So the evidence being from what I see is that I believe Burnage is part of the inner suburbs. I have also put up an aerial photograph of a part of the study area so that you can see what the road and building structure is like etc. Part of the study area is marked red. (You can see very much that the structure is inner suburb like)
Results
Following the collection of my evidence and taking into account my expectations I can now say that I can apply my study area to the Burgess Concentric Ring model and come to conclusions on whether Burnage can be associated with the inner suburbs following the methods of the Burgess model. The evidence that I have used to support my views are the Land Use Map and Housing Map (primary evidence) as well as my own internet research (secondary evidence). From what my evidence shows I can say that Burnage seems to be split in between two zones. It encompasses both the inner suburbs and the inner city of Manchester. The inner city contains houses built before WW1 and consists of terraced housing. The inner suburbs consists of housing built around 1920 and 1930, these are mainly semi-detached houses. So the study area covers 2 zones.
Anomalies (can be found with the help of my Housing map and the internet research of the photograph on the previous page)
There are also some anomalies which are taken into account even though Burnage is part of the inner suburbs.
- It doesn’t fit the pattern.
Evidence
If the Burgess Model was correct, my housing map would show all terraced housing in the inner city and all semi-detached housing in the inner suburbs.
Evidence
Technically this should be found in the outer suburbs as it is an example of infilling.
- Burnage Garden Village (centre of aerial photograph given)
Evidence
This is a beautiful piece of work and according to the Burgess Model the area in which this was built, only inter- war housing should be found however this is also here. Technically it should be further north.
Generally speaking my housing map allows me to acquire the knowledge that models like the Burgess one are often very simple and real cities like Manchester are much more complex in contrast to them. I can also say that Burnage is mainly part of the inner suburb even though its part of the inner city.
Generalisation 2
Gen 2 : It is possible to identify different types of land uses in Burnage, but the main land use should be residential if Burnage is a suburb.
Expectations
My expectations are that I expect to find different land uses in Burnage, however if Burnage is a suburb then the main land use should be Residential.
My reasons being that if it is a suburb then a suburb is a place where people live and so that is why I expect to find the land use residential more than any other in my study area. I can also consider finding other land uses.
I would also expect to find the land use Transport in use mainly too. This is because a suburb is not only a place where people live but it’s also a place where people from the suburb can commute to work and transport is essential for them. I can expect to find some Commercial land use also such as local shops. My reason being, on my way to school I see many local shops. However I don’t expect to find any major shops because Burnage is only a suburb.
I also expect to find evidence of Public Buildings such as schools and libraries. I can back this up because I go to school everyday in the study area. Also in the area of study I see Green end Primary School and Levenshulme High School. As well as all of this I predict to find some Open Space for example Parks or even school fields. Backing it up I can say that I know that there is a planned development which contains open space as well as the school fields to which I visit 5 days a week.
I don’t actually expect to find any Wasteland in Burnage because of the fact that it’s a popular suburb and any land bought would be owned by builders who would definitely use it so there wouldn’t be any. Also I would only expect to find little if not any Entertainment due to the fact it’s a quite area and it is more likely to be found in the city centre. I would expect to find some Altered Land due to the fact that the evidence in my high school, buildings have been knocked down in order to build new ones. Finally I don’t expect to find any Industry in Burnage as Burnage developed in the 20th Century as a suburb. Industry developed earlier in the 19th Century.
Results
From my evidence (Land Use Map, Bar Graph and Pie Chart) I can see that there is a whole variety of land uses in Burnage. I have presented the percentages (from the Pie Chart) of each land use in the study area in a table below. I have also placed them in order of highest percentage.
Residential
My Pie Chart allows me to see that after I worked out the percentages I found out that the main land use is Residential. I also expected to find this because of the fact that earlier I found out that Burnage is mainly part of a suburb. The function of a suburb is to allow people to live.
Transport
The result was also as high as Residential. I expected to find this because Burnage again is mainly part of a suburb so they live in the suburb and commute to work elsewhere and in order to do this they need the land use transport to got to work and back.
Open Space
Now for this land use my figures are distorted because of the fact that Open Space is split between two classifications. The first being school fields and the second public parks. Although school fields have been classified as Open Space it’s not open for everyone to use as well as the parks are. So this is an anomaly due to the fact that 2 different types of land uses in my opinion have been placed under one. I think in order to sort this out I could classify school fields as something else other than Open Space. As this would then give me 2 different answers for my Pie Chart and change my opinions for each one.
Altered Land
The reason why my results matched my expectations was that I found out that Altered Land was present in Burnage. An example is, in schools like Burnage High School have recently altered land in the school. ‘The Sports Hall’ was built over open space. Another example is Hyde Fold which used to be an old hospital and now is a infill site. These are few examples of altered land in Burnage. Also Burnage is a popular place to live and that is the reason why builders are constantly buying land and altering it.
Public Building
It was exactly what I expected to find because of the fact that when Burnage was built and people came to stay they wanted to send their children to school, So in order for this to happen schools and libraries were built for the children. Also residents couldn’t walk long distances to send their children to school so all the schools are nearby to the houses and are in walking distance. This is proved on the Land Use Map.
Waste Land
Although in my expectations I expected to find that there would be no Waste Land at all I was proved wrong. There were some signs of Waste Land, 1.54% in fact. However with evidence from the Land Use Map this can be explained. There is an old railway line which runs through the study area. However this would’ve been altered into something else if it wasn’t for the shape that it was in. The railway line has a dip in it so nowadays it’s just used for walking.
Commercial
In my expectations I expected to find some Commercial land use and that is what I exactly found. Even though the percent is low it is satisfactory for a suburb due to the fact that people want to shop in small local shops for low order goods. However a reason for why it was very low is because the shops have declined. Also there are some high order goods shops where people stop and buy their goods. This is one thing I didn’t expect to find.
Industrial
I actually expected to find no industry at all because industry developed before Burnage did. However I was proved wrong once more because there was a small percentage. The reason for this was (evidence in Historical Maps) there is evidence for a laundry factory which cleaned clothes for a hospital of incurable diseases. The hospital was way out in the city centre while the laundrettes were here. The hospital had to be as far as possible away from anyone.
Entertainment
Finally I expected to find none or little entertainment and from my result I can clearly say that there is no type of entertainment land use in Burnage.
Environmental survey
Extension task
I did an environmental survey of my own street and a street which is nearby to my house, which was Burnham Drive and Devon Avenue. Unfortunately these were just inside the study area for my coursework however they have not been looked at. I put my results into a table.
The environmental scores for the area studied were:
My results compared to the environmental scores table
My results compared to the table above are fairly the same, this is probably because the streets that I examined are in the same study area as the table above. The table above and my results suggest that it is a place where people live. The reason being is that there is hardly any noise or litter. Also the building conditions are fair and there are quite a few gardens. All of these points imply that my study area has a very high residential land use.
Data Collection Map 2004
Land Use Map with Grid
Land Use Bar Graph
Land Use Pie Chart
Housing map
Environmental survey results (Gen3)
House Prices and Graph (Gen 3)
These are some of the house prices which were taken from the agents. I have put these into a graph:
Photographs of Land Use
Photographs of Land Use
Photographs of houses
Photographs of houses
Photographs of houses
Photographs of houses