Building height:
It is very obvious that buildings are more likely to be higher and with more storeys when in the centre, opposed to outside. This is because in the centre land prices are high. So to maximise the area of you plot of land, you build upwards. This is maximising your limited ground floor area by multiplying the area you have by the amount of storeys you build upwards.
Building age:
This is simple, in that a town builds from the inside out and therefore the first buildings to have been built are in the centre where the town originated. As the town expands, new buildings are built outside of the existing meaning the newest houses are on the outskirts of the town.
Environmental quality:
It is logical to say that in the centre the quality of the environment will be worse due to these factors:
- Crowded and busy.
- Noise pollution.
- Air pollution.
- Very little greenery.
- Graffiti.
- Higher crime.
Also these factors outline why the outer areas of town are a nicer place to live:
- Less densely packed
- Gardens, which improve mood
- Buildings lower in height (No eyesore’s)
- Parks and fields for children to play in
- Less crime due to less people.
- Less pollution due to less traffic.
This means that outer town areas are nicer to live in, as generally they are prettier places to be.
House prices
I feel that as there is a higher demand for property in the centre, there will be higher prices accordingly.
Pilot Study
In May 2003 I did a pilot study on Buckingham for this investigation, in order to practice and get used to the methods and techniques involved in performing the final investigation. This was basically a mock or simplified version of the final investigation.
From this study I learnt how to do the investigation (methods) then re-present and analyses it. I only carried out a single transect but that was enough for me to grasp the concepts. Also I had a limited amount of time in which to carry it out, so I didn’t obtain such accurate results as I did on this later investigation.
In my Pilot study, I also had the chance to see factors that could be improved or expanded on, when I came to doing the final investigation. For instance, I saw that it would be more sensible to study two transects rather than one, so I could contrast and compare them to give a more detailed and accurate representation when it came to putting the results into a transect bar graph.
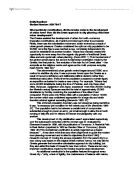
Background to Buckingham:
Buckingham is a small market and commuter town at the Northern end of the Vale of Aylesbury. It is roughly 70kms to the North West of London, in an area of undulating low hills that are predominately rural and agricultural. It is a fairly low order town with only 13,000 inhabitants: the higher order settlements are all about 25kms away – Oxford, Milton Keynes, Northampton and Aylesbury.
By 911AD, it had been developed as a fortified town intended to defend the kingdom of Wessex in the South of the England from the raids of Danish and Viking invaders who were based in the Midlands. The town was built in a meander course so that it was surrounded on three sides by the river Ouse, while on the fourth side in the North a castle was built to complete the circuit of defences.
After the Norman conquest, the town was extended to the North of the castle, with a large market and high street nearly half a kilometre long. Its’ main function was to act as a local market town for the surrounding area. The market and fairs here continued to be held down to the present day. The castle was eventually demolished.
Buckingham remained a small market town until 20th century and as late as 1950, the town had not grown much beyond its’ medieval extent. However, over the last 35 years, it has more than doubled in size. A by-pass has been built, two industrial estates have been developed and the town has acquired a University.
The core itself still functions as the CBD district – the zones of retailing, office, entertainment and public administration. However, the CBD suffered adversely from the impact of the building of an out of town supermarket, this caused a few shop closures. Since this time, however, Buckingham town centre shops have done well. The ‘Meadow walk’ shopping area has been upgraded and the development of a second market area has enhanced the shopping provision.
Data collection Method
In my investigations in Buckingham, I decided to collect eight different sets of data as shown in the model. I collected them using specific methods:
Ground floor land use:
I used a key for collecting this data, which was, S = shops, R = residential, O = offices, I = industrial and Oth = other types of land use. I judged these for each plot that I passed on both transects, and if it was Oth, then I would state its name or what it was. I think that this method is very suited to my investigation as it was easy for me to determine what each building was as the key was kept simple, and it was easier to just write a letter that give a detailed description.
Vehicle Density and Pedestrian Density:
I collected the data for these in a very similar way, I would stop at ten equally spaced points along the transect, and for two minutes I would count the number of pedestrians who walked passed where I stood on only my side of the road, and for vehicles, how many passed me from either direction. This was very useful to me as it took very little time and it was easy to carry out.
Building Density:
I used an indirect method for this, as I counted the number of paces, and therefore the length, of each plot of land I passed. From that, I can tell how close they were together by the amount of verge, garden and greenery spaces in between and around the houses. Also, when the houses were constantly small, I could tell that they were denser as they were crammed into certain areas. This also was good, as it was simple but relatively accurate on a large scale.
Building height:
For this data, I simply counted the amount of storeys each ground use had, and therefore it gave me a rough estimate of height without spending more than five seconds on each house. To measure each house in turn would be too tedious and so my method suited the investigation.
Building age:
I managed to obtain only a few ages of buildings, as they were hard to find or inquire about. When I couldn’t find an exact age, I gave an estimate in the form of either old or modern.
Environmental quality:
I collected this data at the same time as vehicle and pedestrian density, so I stopped at the ten points along the transect, and from where I stood I judged the quality from a set scoring system. This was made up of six different evaluation points on which the area was judged. Every point was out of ten marks, ten being very good and one being extremely low or poor.
The points were:-
- The general quality of nearby buildings.
- The levels of litter nearby (more litter equalled less marks)
- The amount of quality of greenery nearby (more greenery equalled a better score)
- How pleasant the general surroundings were.
- How dense the area was (more dense equalled less marks)
- The volume of pedestrians and traffic and therefore levels of air and noise pollution (more volume equalled less marks)
All of these points were judged in relativity to Buckingham only.
Therefore I obtained a final total out of sixty marks with which to compare the different areas against each other.
Justification of method of Data collection:
Some of my methods could be questioned as to their appropriateness in my particular investigation. I collected ten sets of vehicle and pedestrian densitymeasurements and Enviromental Quality scores equally spaced along the transect as it meant that any anomalies were highlighted and averaged out by the majority of clear results. This amount also suited as we had little time and gathered an equal representation of data for each area of the town in the time constraints in place. I measured vehicle and pedestrian density for two minutes, as this was long enough to gain comparable results without wasting too much time unnecessarily. I used my specific Environmental quality method as it was quick but standardised so each area was judged on the same quantities, also this was subjective as it was my opinion, and it will vary from person to person. I used pacing to measure the plots, as I didn’t need great accuracy as you could gain with a trundel wheel but also it was quick and still easily comparable. I used transects to get samples as it was quick, efficient and it gives an accurate reflection of changes through Buckingham and also the transects are thought to be REPRESENTATIVE of the whole of Buckingham. I measured two transects so that I could get an average when they are compared against each other.
Justification of Data Representation
I presented my general ground floor land use data as transect bar chart because it gave a general map from a side view of the course that I collected my data on. It also showed where shops were more dense in the centre, and that on the outskirts it was mostly all residential. I used line graphs for my data of number of pedestrians and vehicles as it gave a clear depiction of the increase and decrease in pedestrian and vehicle density. I used simple bar chart for Eq score as I could split the bar to say the separate scores of the six different evaluation points at the same time, with little hassle. The reason for aligning all the graphs over each other was so that I could easily and visibly compare the difference results.
Data Analysis:
The aim of the model was to see if Buckingham conformed to it. It is effective to take each graph and therefore the segments of the model in turn.
Transect Bar Graph:
We can see from the transect bar graphs that from the start of my transect 2.4, it consists of a few widely spread houses, this goes on for about 500 paces. Then there is a lone Fire Station, 40 paces in length, next we have a chunk of relatively dense residential property of 450 paces, broken up by garages and streets. Now there are a few lone shops followed by lots of tree land and car parks. Then there is a wide river and an old industrial building; backed onto the last two houses before the centre. We then hit a dense area of shops and Banks and offices (including the Market Square) for 500 paces. This contains my central point halfway through. From here, we go back into dense residential for 200 paces. This makes sense that shops and offices are in the centre as it is more likely that they will be able to afford the high prices in the centre. These high prices are due to the high demand of the central positions too. Also, the residential areas are more likely to be out of the centre as they can’t afford these high prices in the centre. Another reason for shops being in the centre is accessibility, there are more people in the centre as it is the focal point of the town. This means that there will be a high density of customers in the centre.
In the centre the buildings are higher than those on the outskirts. This is because the people who own plots in the centre want to maximize the overall floor space of their limited ground floor area. They do this by building upwards. Going out from the centre, there are some more shops for 300 paces then we move back to an area of residential.
This is further reinforced by the dispersion chart which shows where each land use type prefers to be. It shows that the shops prefer the central areas, along with the offices. Then Industry prefer the area just outside the centre and that residential prefer the cheaper land outside of that.
Environmental Quality Bar Chart:
I depicted this with a set of bars split in two, showing the separate scores for buildings and surroundings. This data shows how the EQ scores decrease as we moved into the centre. The quality was better out of the centre in the residential area, as there were less houses to more space. Also there are areas for children to play safely, and areas of grass for recreation and just looking nice and pleasant. The houses are also better looking and slightly bigger than those in the centre. The quality of life is lower in the centre as there is more rubbish, pollution and general filth in the most well used areas. Also the houses are much more densely packed together and therefore appear smaller than those out of the centre.
Vehicle and Pedestrian densities line Graphs:
These can be completed together as they both follow the same pattern. This is that the densities are higher in the centre than the outer zones. This is because the centre is a much more accessible place, so more people congregate there. Although it is indirectly, as it is accessibility which causes shops to position themselves there, which then in turn attracts people.
The vehicles followed the same pattern as half the people shopping were already underway and walking, and half were arriving or leaving in their cars.
Evaluation:
I have been able to fulfil my aim and complete the investigation properly. I have tested the model on Buckingham and found that it does conform to it. This is especially good, as all segments have conformed. Therefore I can conclude and say that my findings and results do generally agree with the model, with the exception a few anomalies of out of centre shops. Therefore having completed the investigation, I can say that the model does not need changing, although it could be added to, at a later date.
Although my investigation was successful, it did have its limitations and weaknesses. I would have been much better, for instance, to have actually measured the width and height of the buildings if there was enough time available. This could have been done with the use of a trundle wheel or tape measure. Also, the method of data collection for pedestrian and vehicle densities was too inaccurate. This is because they were timed over too short a period of time allowing anomalies to arise, which would otherwise have been evened out over time. Another problem with my data collection methods were that when scoring on Environmental Quality, it was a very opinionated view. This could be improved by scoring each point along the transect with a set making scheme or system. Also the use of paces for measuring the width of buildings was very inconsistent, as my paces were not really consistent.