Analyse and compare the financial status of two UK supermarkets, Morrisons plc and Somerfield plc, for a potential investor who wishes to become a minor shareholder in one of the two company's.
Introduction to Report
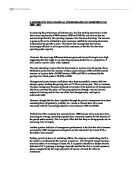
The attached report will analyse and compare the financial status of two UK supermarkets, Morrisons plc and Somerfield plc, for a potential investor who wishes to become a minor shareholder in one of the two company's. To perform this investigation the 2002 financial accounts of both company's have been used, this information will also include the financial data from the 2001 period, for further comparison between years. Please note the following points ~
a, For both company's the period for 2002, includes 52 weeks trading and the period for 2001, includes 53 weeks trading. No alteration for this difference has been undertaken, as both company's have the same discrepancy and to alter the figures would only result in minor alterations and no significant changes to the conclusions made in the report.
b, As each set of financial accounts is shown in different formats between the two companies, with the various components and values represented at different stages and headings. I have re-structured the profit & loss accounts and the balance sheets for the two company's. So that the relevant information is shown in a standard, Profit & Loss Account and Balance Sheet, therefore making comparisons between the two company's easier and more beneficial. Where this has not be possible and potential conflicts of interest have occurred, these limitations to the analysis have been noted and described in the report text.
c, The writer of the report has no link to either company, through employment or otherwise.
Company Description
W.m. Morrisons Supermarkets plc operates 113 Morrisons supermarket stores ( 4,039 thousand sq.ft ) throughout the United Kingdom. The Company's supermarkets sell groceries, fresh and frozen foods, home and leisure products, music and video, health and beauty products. It offers over 20,000 different products under its own or other brand names
Somerfield plc. The Groups principal activity is food retailing in the United Kingdom. The Group operates 1306 stores ( 10,963 thousand sq. ft ) with over 6,000 own label products, more than 65 fresh organic lines and over 300 organic products. Own label brand ranges include taste of Orient, Part, So Good, Good Intentions and Basics. Other activities include property holding, concessions management, insurance and merchant services.
Sales Analysis
Morrisons, turnover as stated in the " Chairman's Statement " has continued to increase since the company went public in 1967, this being backed by the figures shown in the six year summary. In 2002 turnover stood at £3,918.3 million, which on average relates to £34.7 million per store ( £970 per store sq ft ), this being an increase of 11.9% on the previous year.
Although Somerfield plc had a higher turnover of £4,640.5 million in 2002, this however only equates to average sales of £3.6 million per store ( £423 per store sq ft ), which is significantly less than the Morrisons average sales per store figure. This representing a very small increase of 2.5 % on the 2001 period's turnover.
Profitability Analysis
Again looking at Morrisons, " Chairman's Statement " it can be seen that pre - tax profits have increased each year from 1967, with the six year summary confirming part of this announcement.
With a very healthy gross profit margin of 24.00% ( £940.2 million ) in the period 2002, compared to 23.81% ( £833.5 million ) in the period 2001. This actual increase of 12.8 % being higher than the Turnover percentage increase between the two periods, this would suggest that Morrisons management of raw materials costs has improved resulting in an improved gross profit per £1 Turnover.
With reference to Somerfield, the periods 2002 and 2001 both produced positive gross profit figures, £89 million in 2001 and £126 million in 2002, an impressive increase of 41.5%. Though this management improvement of reducing costs of goods sold, has still produced very low gross profit margins, 1.97% ( 2001 ) and 2.97% ( 2002 ). Which may suggest that Somerfield's products are priced very cheaply to create a greater quantity of sales.
The above figures however cannot be compared as Morrisons gross profit is a result of raw materials only, whereas Somerfield includes all aspects relating to the costs of goods sold ie raw materials plus warehousing, store operating costs. ( Note 1 in the accounts ). A more accurate set of ratios for comparison, would be the Operating profit margin and the Net profit margin.
Morrisons operating profit margin in 2002 being 5.86 % ( £204.3 million ) an overall percentage increase of 12.5% from the previous period, again suggesting Morrisons overall cost management has improved. However the Net Profit Margin in the two periods show a percentage decrease, 4.08% in 2001 to 3.95% in 2002. Further analysis suggests that the 2001 figure has been assisted by the exceptional item of +£5.4 million, shown in the accounts notes as "profit on sale of land and buildings".
Somerfields operating profit margin shows a return to a positive value, with a negative 0.49% ...
This is a preview of the whole essay
Morrisons operating profit margin in 2002 being 5.86 % ( £204.3 million ) an overall percentage increase of 12.5% from the previous period, again suggesting Morrisons overall cost management has improved. However the Net Profit Margin in the two periods show a percentage decrease, 4.08% in 2001 to 3.95% in 2002. Further analysis suggests that the 2001 figure has been assisted by the exceptional item of +£5.4 million, shown in the accounts notes as "profit on sale of land and buildings".
Somerfields operating profit margin shows a return to a positive value, with a negative 0.49% in 2001 in relation to a positive figure of 0.5% in 2002. The Net profit margin figures both show improvement, 0.61% in 2002 and -0.15% in 2001, the result of profit achieved in the disposal of fixed assets and a tax credit of £6.5 million in 2001 and £6 million in 2002.
In conclusion Morrisons plc is by far the most the profitable company, when compared to its competitor Somerfield plc.
Table I ~ Profitability
Gross Margin =
This value measures the percent of revenue left after paying all direct production expenses.
It is calculated as Revenue minus the Cost of Goods Sold divided by the Revenue and multiplied by 100.
Operating Margin =
This value measures the percent of revenues remaining after paying all operating expenses.
It is calculated as Operating Income divided by the Total Revenue, multiplied by 100.
Net Profit Margin =
Also known as Return on Sales, this value is the Income after taxes divided by Total Revenue for the
same period and is expressed as a percentage.
Somerfield Plc
WM. Morrisons Plc
~ 2002 ~
~ 2002 ~
~ 2001 ~
~ 2001 ~
Gross Margin
2.72%
24.00%
23.81%
23.81%
Operating Margin
0.50%
5.86%
5.84%
5.84%
Net Profit Margin
0.61%
3.95%
4.08%
4.08%
Financial Position ( Day to Day Operations )
At the end of 2002, Somerfield plc had negative working capital, which saw a further reduction from 2001. In respect to Morrisons who had a larger negative working capital, but an improvement between 2001 and 2002.
To analysis the business risk, the Acid and Current ratio's can be calculated for the two company's. As shown Somerfield's "current ratio" figures are fairly higher than those of Morrisons. Although when compared to the "Acid ratio" figures the gap is reduced in 2001 and in 2002 Morrisons produces a higher acid ratio figure than that of Somerfield. This would imply that Morrisons current assets are more liquid than those of Somerfield.
These low ratio figures indicated above, along with a negative working capital could indicate that the company's will have problems in expanding. However, negative working capital in and itself is not necessarily bad, and could indicate that the company is very efficient at turning over inventory or their debtors and creditors are managed effectively. As the company's are both supermarkets, one would expect this to be true.
Supermarkets, as with most companies generate their cash predominantly through their trading activities, this cash flow from operating activities is therefore used to pay the day to day obligations of company. To represent how effective the company is on paying these current liabilities, the following ratio can be used ~ Operating Cash flows divided by Current Liabilities.
As expected from a company in the supermarket industry the ratio figures are low, with Morrions ability to pay short term obligations downgraded from 0.65 : 1 to 0.59 : 1. The cause of this reduction being an increase in all aspects of the company's current liabilities, especially the £24.4 million increase in the bank overdraft, and only a small increase in operating cash flow.
( Morrisons ~2002 = £359.4 million / £614.7 million, 2001 = £355.1 million / £548 million )
Somerfield's figures produce the same reduction in bill payment ability between the periods, but are significantly lower than that of Morrions ~ 0.23 : 1 in 2001 to 0.17 in 2002. Although there has been a small increase in current liabilities, the reduction in ratio value is due to a £35 million lower cash inflow from operating activities.
( Somerfield ~ 2002 = 116.3 million / 669.7 million, 2001 = 151.2 million / 651.6 million )
As common in the supermarket industry the above figures are low, with Morrisons statistics figures showing no cause for alarm. However Somerfields ability to pay for short term payment obligations, through their operating cash flow does raise concern and highlights poor cash flow management. From item 3b in the "Notes to the Accounts" the reduction in cash flow had shown changes in debtors and decrease in stocks as the main factors behind the larger 2001 operating cash flow.
Table II ~ Financial Position
Working Capital =
Current Assets minus Current Liabilities.
Acid Ratio =
Cash & Short Term Investments divided by Total Current Liabilities for the same period
Current Ratio =
Total Current Assets divided by Total Current Liabilities for the same period
Somerfield Plc
WM. Morrisons Plc
~ 2002 ~
~ 2001 ~
~ 2002 ~
~ 2001 ~
Working Capital
-140.9
-75.2
-286.7
-324.2
Acid Ratio
0.13
0.20
0.31
0.16
Current Ratio
0.79
0.88
0.53
0.41
Management Effectiveness ( Day to Day Operations )
Table III
Somerfield Plc
WM. Morrisons Plc
~ 2002 ~
~ 2001 ~
~ 2002 ~
~ 2001 ~
Average Settlement period, debtors, receivables ( days )
6.37
5.97
.27
.20
Average Settlement period, creditors, accounts payable ( days )
38.27
37.21
42.00
43.62
Average Stock Turnover Period ( days )
26.26
27.13
5.37
7.24
From the ratios above, the assumptions made due to a negative working capital are correct. With stock turnover being fairly quick, and both company's showing a reduction from the previous year. The average settlement period of debtors, receivables has increased for both company's between the two periods. In both these current asset related statistics, Morrisons is outperforming Somerfield, although one would expect Somerfield stock turnover to be higher due to, as stated previously their calculation is based on total cost of revenue, not just raw materials as with Morrisons.
In relation to average settlement period for creditors, accounts payable, Morrisons ratio figures are higher than those of Somerfields. Although a comparison between supermarkets is limited as the Somerfields calculation only includes trade creditors, whereas Morrisons includes trade creditors plus some accruals.
In summary Morrisons day to day operations regarding stock, trade debtors and creditors, are being managed more effectively than their competitor Somerfield, however the strength of this conclusion is limited.
Financial Position ( Long Term Operations )
In relation to how each company is financed, through debt and equity, one can use the "Gearing Ratio". As of 2002, Somerfields long term debt was £59.3 million and a total equity value of £733.1 million, resulting in a very low gearing ratio of ~ 0.08. Which is less than half of the previous years gearing ratio figure, one would expect the reduction to be a movement of long term debt to short term. Yet Somerfield has no short term debt for either period, meaning that the long term debt has been paid off, in the 2002 period. This being confirmed in the cash flow statement under the "movement in bank loans" heading.
One cannot compare Somerfields gearing statistic to Morrisons, as Morrisons have no recorded long term debt for either periods, as mentioned in the "Chairman's Statement" the company is un-geared. Hence their gearing ratio, results in a zero value, which could suggest that although Morrisons is fully financed by equity, the company is not taking advantage of tax reduction benefits through interest payable. Yet in the notes to the accounts, no. 5, there are values for interest payable. Further investigation shows that Morrions debt is only short term.
Therefore to make a comparison between the two company's, the total debt equity ratio can be calculated. Nevertheless in both cases, the company's are largely financed by equity. Hence there is little or no, risk through debt to both business.
Even without debt, a significant non-debt tax shield has been created, by Morrisons through depreciation chargers to the Profit & Loss Account.
Table IV ~ Financial Position
Gearing Ratio =
Long Term Debt divided by Total Equity
Total Debt Equity Ratio =
Short Term Debt + Long Term Debt divided by Total Equity
Somerfield Plc
WM. Morrisons Plc
~ 2002 ~
~ 2001 ~
~ 2002 ~
~ 2001 ~
Gearing Ratio
0.08
0.19
0.00
0.00
Total Debt Equity Ratio
0.08
0.19
0.07
0.05
Management Effectiveness ( Long Term Operations )
Having established how effective the management of each company is, in regard to the varies short term aspects ie stock, debtors and creditors of the businesses. One can take the analysis further and investigate a company's ability to operate profitably, in relation to the equity, debt and total assets employed in the company. This examination of the two business being more beneficial to the long term investor, as it enquires whether their money is being put to good use.
The Return on Shareholders Funds, tries to identify the profit and therefore the return due to the shareholders of the company. Taking into account that Morrisons do have to pay non-equity dividends, the return on ordinary shareholders funds, plus reserves has seen a reduction from 14.51% in 2001 to 13.95% in 2002. Also as expected due to Morrisons having no long term debt, the same decline is concluded for the Return on Capital Employed, even when a reduction in non equity share capital has occurred. The reason behind this deterioration is largely due to the increase in the retained profit & loss section of the shareholders equity. Which in turn may suggest that the Morrisons management is retaining more profit than is required and justified.
As predicted due to Somerfield producing a loss in 2001, both ratios for this period, the Return on Shareholders Funds and Return on Capital Employed result in negative values. Compared to 2002 which saw small, but positive outcomes.
The Return on Assets ratio, measures how well a company's management uses its assets to generate profits. It is a better measure of operating efficiency than the two ratio's mentioned above, as these do not take it consideration all the varies types of debt / other company funding. Again the Morrisons ratio figures see a small reduction between the two periods, on inspection of the balance sheet the reduction is due to the large 212% increase in short term investments.
A positive profit value in 2002 and a decrease in the value of total assets, mainly through a reduction in cash held by Somerfield, issued a positive Return on Assets ratio set against the negative result of 2001.
Even through Morrions have produced better ratio figures in both periods compared to Somerfield, the company could make better use of their funding and total assets. Which in turn may create further value for the shareholders.
Table V ~ Management Effectiveness
Return on Shareholders Funds =
Income available to shareholders divided Total Equity, shown as percentage
Return on Capital Employed =
Profit before tax divided by Total Equity plus any Long Term Loans, shown as percentage
Return on Assets =
Profit before tax divided by Total Assets, shown as percentage
Somerfield Plc
WM. Morrisons Plc
~ 2002 ~
~ 2001 ~
~ 2002 ~
~ 2001 ~
Return on Shareholders Funds
3.85%
-0.93%
3.95%
4.51%
Return on Capital Employed
2.80%
-1.56%
21.82%
22.06%
Return on Assets
.50%
-0.87%
3.65%
3.74%
Dividend Analysis
As Somerfield produced a negative profit and loss figure in the period 2001, one as expect would have the earnings per share to be a negative value of -1.36 pence, due to this loss the company did not pay out a dividend in the 2001 period, and therefore even rejected the possible dividend payment from the Profit & Loss Accounts capital reserves, which at the time was quoted at £213.6 million. With the 2002 period producing a positive profit & loss figure, dividends to the total of £4.9 million were paid to the shareholders. This dividend figure of 1 pence per share, in relation to the earnings per share figure of 5.81 pence, produced a payout ratio of 17.21 %.
From Morrisons six year summary one can conclude that both the earnings per share and dividend per ord. share have increased, over the six year period. This with a continuing reduction in dividend cover, which means an increasing payout ratio, suggests that any potential investor who has become a shareholder in the company has seen a better return on their investment as each financial year has passed.
The period between 2002 and 2001 saw earning per share increase by 7.63%, from 9.31 pence in 2001 to 10.02 pence in 2002. 42 % higher than it competitors Somerfields. Dividends increased by a larger percentage factor of 22.2 % between the periods, from 1.8 pence in 2001 to 2.2 pence in 2002, more than double that of Somerfields dividend payment in the same year.
Taking the average market share value of the two company's, which are quoted on the UK Stock Exchange, one can calculated the Dividend Yield Ratio and the Price Earnings Ratio.
Somerfield's average stock market share price increased 39 %, from 79.15 pence in 2001 to 110.3 pence in 2002. With a dividend yield in 2002 of 1.30 %.
Morrisons average stock market share price also saw an increase, from 125.55 pence in 2001 to 161.70 pence in 2002. Although this 29% increase in share price, resulted in lower Dividend Yield Ratio and Price Earnings Ratio figures between the two years, due to the dividend payment only increasing by 22 %.
Table VI ~ Dividend Information
Divided per Share =
Dividends Announced for the period divided by the shares outstanding.
Divided Payout Ratio =
Dividends per Share / Earnings per Share, shown as percentage
Divided Yield Ratio =
The dividend per share / ( 1 -corporate tax rate 30 % ), / Average Market Value per share.
Earnings per Share =
This is the income available to shareholders divided by the basic average no. of shares
Price Earnings Ratio =
The average market value per share / Earnings per Share.
Somerfield Plc
WM. Morrisons Plc
~ 2002 ~
~ 2001 ~
~ 2002 ~
~ 2001 ~
Dividend per Share ( pence )
.00
0.00
2.20
.80
Dividend Payout Ratio
7.21%
0.00%
21.95%
9.35%
Dividend Yield Ratio
.30%
0.00%
.94%
2.05%
Earnings per Share, Basic ( pence )
5.81
-1.36
0.02
9.31
Price Earnings Ratio
10.3
n/a
73.5
69.67
Recommendation
The attached information has compared two supermarkets, Morrisons plc and Somerfield plc, in respect to the company's financial position and management effectiveness both in the short and long term view. In all of the test areas, Morrisons have outperform Somerfield, therefore a potential long term investor wishing to become a shareholder in one of the two company's, should choose Morrisons for the following reasons.
a, The company has a strong financial position, with no risk from debts. Hence the shareholders have full claim on the company's profits.
b, The dividend per share has increased over the last 6 years by an average of 21% each year.
c, The company's retained profit level, may have reached a point beyond servicing new investment opportunities. Hence the management may process, either a special dividend payment or re-purchase shares at a premium in the near future.
d, The management team are effective in all aspects of the company's operations, and have continued to improve on the previous year's efficiency level. Thus creating further value for the shareholders.
e, As part of the Morrisons senior management team, belong to the family who start the business and still own a majority share in the company, this reflects on the low agency cost to company.
f, From the two graph's below showing the percentage gain on stock market share prices. Morrisons shares have a stable growth rate, above that of two other competitors in the market and the average " Food & Drug Retailers " bench mark.
Somerfield's although having, on average a higher percentage gain, shows a lot more variation.
References
www.morrisons.plc.uk
( Average share price data was achieved by telephone, to the company head office. )
www.somerfield.co.uk
( Average share price data was achieved by telephone, to the company head office. )
www.thisismoney.co.uk
( Share price movements )
Peter Atrill & Eddie Mclaney ( 2001 )
Accounting and Finance, for non-specialists, Third Edition
Prentice Hall
Richard Lewis & David Pendrill
Advanced Financial Accounting, 4th Edition
Pitman Publishing, Chapter 13
Appendix
I ~ Standard Profit and Loss Account
II ~ Standard Balance Sheet
III ~ Summary of Ratio Analysis
IV ~ Analysis on Morrisons Six year Profit & Loss Summary
V ~ Morrisons plc, 2002 Accounts
VI ~ Somerfield plc, 2002 Accounts
Appendix V ~ Morrisons plc, 2002 Accounts
Appendix VI ~ Somerfield plc, 2002 Accounts