Analysis
Model Details and Assumptions
The Gordon Growth Model uses the current average dividend payout ratio of the entire stock market as a starting point to calculate the ERP. However, the current average dividend payout ratio is very arbitrary, and is subject to variations in macro-economic conditions. For example, when nominal interest rate is high, companies will spend less money on new projects based on NPV analysis, and therefore drive up the current dividend payout. The second problem of Gordon Growth Model is that it uses the consensus forecast of real GDP growth rate to estimate the growth rate of average dividend payout. The assumption that average growth rate will be constant and grow in line with the real GDP is unrealistic. Many other macroeconomic factors, such as the difference between the consensus expectation of GDP growth and the realized GDP growth, as well as firm-specific characteristics, also have a significant impact.
The Earnings Yield Method is based on the assumption of economic equilibrium - if a company has a choice of buying its own stock, building a new factory, or buying a new company, the expected return on all three options is the same. Equivalently, a company is going to reinvest its retained earnings at its own quoted P/E ratios. Although not always accurate, this describes the long run average investment return and decision making process of companies in stock market. The parameters used in this method are independent and are not subject to economic conditions. In addition, the dividend payout ratio and dividend growth rate reflect the worth of different actions (including buy back stocks, reinvest, or pay dividend) and implicitly determine the current earnings yield. The Earnings Yield Method adjusted the original P/E of 19.3 to 29.3 with several corrections. The adjustment is missing one influencing factor: the impact of inflation on the real values of creditor claims. Modigliani and Cohn (1979) showed that GAAP-based earnings of leveraged companies overstate the cost of debt, because the value of the principal returned to creditors will be lower in real terms because of inflation than what they lent.
Connection between the two models
According to the Gordon Growth Model, current share price equals dividend divided by the difference between return on equity (ROE) and dividend growth rate (G). In theory, sustainable growth rate of a firm is the maximum growth rate that a firm can sustain without having to increase its financial leverage. If a firm never pays out dividend and retains all its earnings inside the firm, then its sustainable growth rate should just be as large as its ROE. In reality, most firms have to pay dividends with a firm-specific dividend payout ratio (say b). Taking this into consideration,
The equivalence of these two models relies on appropriate calculation of dividend growth rate. To estimate it, the research group used the consensus forecast for real GDP growth, instead of sustainable firm growth rate, thus leading different results from the two models. As explained earlier, real GDP growth has a rather weak correlation with firm-specific growth, not to mention their dividend growth rates. Therefore, the inappropriate way to estimate dividend growth rate is the key to explaining the difference in answers derived from these two methods.
Conclusion
Based on our analysis, we would recommend Baz to emphasize on the Earnings Yield Model because this model is more robust and the Gordon Growth Model is based on assumptions which might not be accurate. However, EYM is not necessarily the perfect answer, since it assumes that the economy is in equilibrium.
Alternatively, we could recommend Baz to include both approaches when meeting DB’s clients. Even though the two approaches give different results, this could give the client an idea about how equity risk premium could vary under different market conditions. The difference between the results of the two methods can help the client identify how much the ERP is overstated, and therefore manage the investment portfolio at the desired risk level.
Exhibits
Table 1. Comparison of the two alternative methods
Table 2. Standard Errors in Historical Risk Premiums1
_________________________________________________________________________________
1 Equity Risk Premium : Determinants, Estimation and Implications, Aswath Damodaran, Stern B.S.
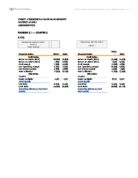
Table 3. Summary Statistics- U.S. Stocks, T.Bills and T. Bonds- 1928-20102
(to elaborate the high riskiness of investing in Stocks rather than bonds)
_________________________________________________________________________________
2 Equity Risk Premium : Determinants, Estimation and Implications, Aswath Damodaran, Stern B.S.