The Human Development Index (HDI) offers a wide perspective on the question of how well people are living. It was devised by the United Nations in the 1990; the HDI is a composite of three different indicators: life expectancy at birth, education as measured by a combination of school enrolment, adult literacy and standard of living as measured by a variation on GDP per capita that adjusts for price differences between countries. The HDI is an attempt to represent human well-being and allow comparisons among different countries/regions. The HDI is the first broad-ranging of capability and basic needs approaches. Its relevance has proved to be very meaningful UN agencies and governments all over the world. The Human Development Index has been compared to be an alternative to GNP and income based measures. The Gross Domestic Product is limited to the information that is available to the public in response to welfare and Happiness. GDP per capita does not provide any information relevant to the distribution of income in a country as to Gross National Income (GNP). GDP per capita does not take into account negative externalities from pollution consequent to economic growth. Thus, the amount of growth may be overstated once we take pollution into account. GDP per capita does not take into account positive externalities that may result from services such as education and health. GDP per capita excludes the value of all the activities that take place outside of the market place (such as cost-free leisure activities like hiking).
One of the popular measures of welfare is the index of sustainable economic welfare (ISEW). This group starts with consumption, as measured in GDP; this specific group makes various adjustments to account for factors that GDP ignores. The advantages of ISEW as an indicator includes social and welfare aspects of sustainable development as well as the distribution of resources in a society adding to welfare. The transactions outside the market process and usage of natural capital are considered. The society debates on whether GDP (national income) is important or the ISEW, which indicates standard of living per capita. Although alternatives may vary for example genuine net savings, GPI and Gross National Happiness, these all indicate welfare and standard of living.
These include inequality; the greater the inequality the more the figure for consumption is reduced. This is based on the assumption of a diminishing marginal utility of income, such that an additional pound is worthless to a rich person than to a poor person. Household production is also accounted for which GDP ignores, this involves various do-it-yourself activities. These services of household labour add to welfare and are then entered as a positive figure.
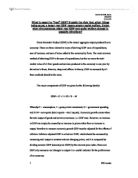
This
This chart shows the United Kingdom annual Gross Value Added (GVA) and Current Index of Sustainable Economic Welfare for each year from 1996 – 2006. The chart shows that UKs Welfare dropped to a negative value by 2005 and continued on to the next year.
This shows the southeast of England components of production. Showing as income equality falling behind, household labour was rising. Showing that household income is at a rise as well as their individual needs and therefore consumer expenditure increases.
The U.K. economy emerged from recession in the fourth quarter at a faster pace than previously estimated Gross domestic product rose 0.4 percent from the third quarter, compared with a previous calculation of 0.3 percent
GDP was 3.1 percent lower in the fourth quarter than a year earlier; compared with a previous estimate of 3.3 percent Output shrank by 6.2 percent since the first quarter of 2008, making the recession the longest and deepest on record. )
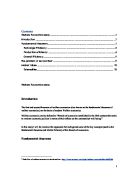
This shows the GVA (Gross Value Added) 2007/08 of UK
Inner London contributed £171.6bn to the UK economy, measured in terms of gross value added (GVA), the highest contribution of any sub-region in 2007. Inner London also had the highest GVA per head of population, at £57,180. This compares to the UK average of £19,951 per head (UK less Extra-Region). Inner London’s per head index of 286.6 (where UK=100) shows that its GVA per head is over two and a half times greater than the UK average.
West Wales and the Valleys had the lowest GVA per head index in 2007 (63.2). Its GVA per head was £12,617.
GVA increased in all sub-regions (NUTS2) and local areas (NUTS3) of the United Kingdom during the period 2006 to 2007. The strongest growth among all NUTS2 sub-regions over this period was 7.8 per cent in Inner London, followed by 6.8 per cent in East Anglia and Eastern Scotland. The sub-region with the weakest growth was Lancashire, which grew by 3.8 per cent. ()
Conclusion
The discussion shows that GDP is not a complete measure of welfare and is not meant to be. This is why they are alternative groups to measure the welfare and income per capita as well as happiness. The adjustment which each of group has made to GDP is personal consumption to account for inequalities. To add in public expenditure on health and education, account for domestic labour and adjust for service flow from consumer durables. HDI uses statistics to rank countries by human development in developed, developing or underdeveloped countries. This cannot be composited without GDP. Data from GDP may have incomplete information but these gaps in data are carried out by each group and focused on in detail to succumb to full data analysis.
References
John Sloman 5th edition
John Sloman 7th edition
J.Jacques (economic issues)
(Word Count 1,167)