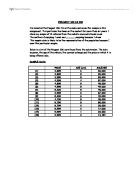
I've selected the Peugeot 306 2.0 as the make and model for sample in this assignment. This particular has been on the market for more than six years. I chose my sample of 15 vehicles from the website www.autotrader.co.uk
PEUGEOT 306 2.0 XSI I've selected the Peugeot 306 2.0 as the make and model for sample in this assignment. This particular has been on the market for more than six years. I chose my sample of 15 vehicles from the website www.autotrader.co.uk The method of sampling I used was ....................sampling because I chose This sample data is likely to be the representation of the population because I used this particular sample. Below is a list of the Peugeot 306 cars found from the autotrader. The data includes, the age of the vehicle, the current mileage and the price at which it is being offered sale. SAMPLE DATA PRICE AGE (yrs) MILEAGE [1] 3,895 6 60,000 [2] 3,895 5 90,000 [3] 3,950 5 53,000 [4] 4,995 4 57,000 [5] 4,895 5 48,000 [6] 4,995 5 49,000 [7] 5,300 5 48,000 [8] 3,995 6 87,000 [9] 5,200 6 49,000 [10] 4,700 5 48,000 [11] 5,750 5 50,000 [12] 8,799 2 30,000 [13] 8,999 2 7,000 [14] 9,999 22,666 [15] 9,999 2

Produce a critically annnotated bibliography of one of the following: Unemployment, Crime, Inflation
Produce a critically annnotated bibliography of one of the following: Unemployment, Crime, Inflation Operational definitions. Crime in this paper is to be taken as any act regarded as a criminal offence by the respective governing bodies, that is government and subsequently, the judiciary and police force. The bibliography is to be limited to England and Wales over the past twenty years. Bibliography. British Crime Survey. Mike Hough and Pat Mayhew. Home Office Research report. Reported in "Crime Statistics England and Wales". Time Cover: !975-1993. Country Cover: England and Wales. Operational Definitions: The statistics, in conjunction with "The general Houshold Survey" are used to estimate the level of unreported crime. It is defined as an act against an individual or property that is forbidden by law. Each years' publication of "Crime Statistics England and Wales" relates to the relevant survey and covers the same areas as the official statistics. Although these are still official statistics, they do allow a certain amount of independent analysis. Media availability: Book form available in the Essex University library. The British Crime Survey http://www.open.gov.uk/home_off/crime3.htm Time Cover: 1983-1993. Country Cover: England and Wales. Operational Definitions: there are no explicit operational definitions here and so assumptions that it is the same

Statistics Coursework
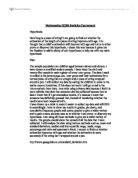
Statistics Coursework Investigate what influences the price of a second hand car: Introduction During this maths coursework I will be investigating the factors that may affect the price of a second hand car I decided to choose 30 random cars from a database of 100 cars and use graphs to prove my hypotheses. I chose 30 cars as I will have enough data to make hypotheses, but choosing more than 30 cars would be too much data to use. To choose my random 30 cars I did a method called 'Random Sampling' I did this method by pressing shift ran# on my calculator which gave me a random number, multiplying that number by 100 and then rounding it up to the nearest whole number. To do my graphs I used a computer to be more accurate. I did this by highlighting the data I wanted to use and selecting the new chart button. On my scatter graphs there were three cars that showed up as anomalies as they were further apart from the rest of the data because of this I repeated my scatter graphs for every hypothesis. I have included both sets of graphs in my work. Hypothesis 1 The higher the mileage the lower the value of the car. I expect my graphs to show that the greater the mileage the lower the value of the car. To investigate this hypothesis I used a bar chart and scatter graph (see graphs) From my results I can see that the number of owners does affect the price of a car. I
Maths - Second hand cars.
MATHS GCSE COURSEWORK SECOND HAND CARS All cars depreciate in value and there are several factors that influence this depreciation. Therefore the objective of this assignment is to statistically analyse the data of second hand cars provided as apart of the coursework and using mathematical knowledge conclude which factors affect the price of a second hand car and furthermore conclude how much influence these factors have on the second hand price. Firstly in order to differentiate the key factors that influence the price of a second hand car, I have re-arranged the list of 100 cars by depreciation (lowest to highest). I decided to do this in order to become aware of any price affecting patterns and thus set myself an appropriate hypothesis in order to achieve the most accurate results possible. I have decided to represent the price depreciation of a car as a percentage. This is mainly due to the reason that each car has factors restricted to that car only. For example the price of a second hand car is dependant on its original value as well as the other influential factors. Consequently this will allow me to compare the data in one constant flow and allow a correlation to be seen when illustrated as graphs. The percentage is worked out using the following calculation: Original Price - 2nd Hand Price= Price Differentiation Price Differentiation / Original Price =
Mathematics Gcse Statistics Coursework - How Long Is a Piece of String?
Mathematics GCSE Statistics Coursework Hypothesis: How long is a piece of string? I am going to find out whether the estimation of the length of a piece of string improves with age. It is thought that a child's estimation will improve with age and I aim to either prove or disprove this hypothesis. I chose this task because it gives me the freedom to add in plenty of sub-hypotheses to help me with my main hypothesis. Plan: The sample population are children aged between eleven and sixteen. I have chosen a stratified random sample. I have taken the sixth and twenty-first people in each register of every tutor group. The data I need to collect is the persons age, sex, tutor group and their estimations for a normal piece of string flat out straight and a piece of string wrapped around a pen. I will collect my data by asking the children to come to the maths room at lunchtime. If this does not work I will go round to the tutors and ask them there. I am only using primary data because I feel it is more reliable than data that someone else has collected because then at least I know that if I get anomalous results, it's because I know that someone has definitely guessed that, instead of wondering whether the results have been tampered with. I have drawn up a table to make it easier to collect my data and will fill it in accordingly. I aim to show my results in graphs, pie
Quantitative Methods
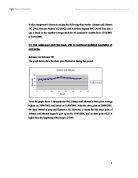
In this Assignment I choose to analyse the following three stocks: Johnson and Johnson DC (JNJ), Hewlett Packard CO (HPQ) and American Express INC (AXP). The data I use is based on the monthly average stock for 30 consecutive months from 31/12/2003 to 31/05/2006. Q1 This Assignment shall first begin with an individual statistical description of each series. Johnson and Johnson DC The graph below show the share price fluctuation during that period: From the graph above it demonstrates that Johnson and Johnson's share price average highest on 29/04/2005, and lowest on 31/03/2004. After the share peak on 29/04/2005, the share started to drop and fluctuate a bit. However, it seems that the share price of Johnson and Johnson began to pick up on the 31/01/2006, and its share price 60.22 is higher than the beginning of the sample (51.66). Johnson and Johnson Mean 59.78333333 Standard Error 0.882586759 Median 59.66 Mode #N/A Standard Deviation 4.834126768 Sample Variance 23.36878161 Kurtosis -0.890698478 Skewness -0.015033442 Range 7.91 Minimum 50.72 Maximum 68.63 Sum 793.5 Count 30 The table above is a descriptive statistic of the Johnson and Johnson's stock during the period using Microsoft Excel. In here, because the mean (59.78333333) is very close to the median (59.66), the points on the distribution appear approximately symmetrical. We can assume

Decreasing fertility rates across England & Wales and its relationship with increased cases of sexually transmitted infections seen in Genito-urinary medicine clinics: A case study.
Decreasing fertility rates across England & Wales and its relationship with increased cases of sexually transmitted infections seen in Genito-urinary medicine clinics: A case study Over the past two decades England & Wales have been experiencing total fertility rates (TFR) lower than the necessary value for replacement of generations. At the same time new cases of sexually transmitted infections (STI) reported by Genito-urinary medicine (GUM) clinics have been steadily increasing. This case aimed to analyse the potential relationship between decreasing fertility rates in England & Wales and the number of new cases of STI's reported by GUM clinics. Using raw data from the Annual abstract of statistics and the Department of health & social security, TFR between 1951-98 were calculated and correlated, using SPSS, with the total number of new cases of STI's. As a result a significant relationship between TFR & STI's was found. It finishes by explaining the relationship between fertility rates and STI's and looks at other, perhaps more influential factors affecting fertility rates, e.g. the introduction of the contraceptive pill, and the more recent trend in England and Wales towards later childbearing. Europe is currently experiencing it lowest ever fertility levels and its longest ever period of fertility below replacement levels (Day 1995). By mid-1998 England & Wales

After careful consideration over the possible investigations that can be carried out with the data at hand, I have made a decision on the investigation that I am going to carry out.
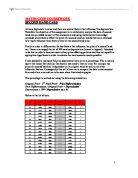
Statistics Coursework AIM: After careful consideration over the possible investigations that can be carried out with the data at hand, I have made a decision on the investigation that I am going to carry out. I want to investigate the times in ten minute periods at which goals are scored; this will be done for all four of the league results that I have. I want to do this investigation so that I can find out in what ten minutes of the game, the most goals are scored. METHOD: The way in which I can obtain the data that I want to analyse, has to be unbiased. The reason is so that the investigation becomes fair and as correct as it can possibly be. I already have me resource for data, this resource contains the football results from four of England's largest football leagues and contains the results of them for six consecutive weeks. I am going to use this resource to carry out my investigation; these results are totally factual and have no biased approach to my investigation whatsoever. From observation of the resource that I have, I see that the Premiership league has less games played on a weekly basis than the other leagues do, this is due to less teams being in the Premiership than in the other leagues and divisions. Due to this, I will have to pick as many teams as possible per week from the Premiership for analysis, and then use that same number to pick from

Titanic Stats
<SIDS31081 Statistic Analysis Report> The statistic analysis of survival ratio on TITANIC 7, December 2009 Yoonsun OH Adrian VLAD Contents . General information 3 .1. Age 3 .2. Gender 4 .3. Ticket Fare 5 .4. Survival ratio 7 2. Comparison 8 2.1.1. Age and Survival 8 2.1.2. Gender and Survival 9 2.1.3. Ticket Price and Survival 10 3. Conclusion 11 . General information There were various kinds of passengers on TITANIC in terms of the factors, which are age, gender and ticket fare; moreover, survival ratio is one of the key quantitative elements to analyze the information of TITANIC data. .1. Age Statistic age st Quartile 21.000 Median 28.000 3rd Quartile 39.000 Mean 29.881 Kurtosis (Pearson) 0.141 Kurtosis (Fisher) 0.147 Average age of the passengers of TITANIC was 29.88 years old. Considering the fact that 25% of the passengers were younger than 21 (1st quartile) and only 25% of passengers were older than 39 (100% - the 3rd quartile), half of the passengers' age was between 21 and 39 (3rd quartile - 1st quartile), which indicates that the population of TITANIC was quite young. The range of the age was pretty wide (79.833), since the youngest baby was 0.167 and the oldest was 80. Therefore, even though the majority of passengers were young, each category of ages from 0 to 80 had some representatives. General equilibrium of the age (mean) is

Looking at the similarities and differences between jobs and pay that effect the young and old, and between men and women.
Main Introduction In this piece of coursework, I will be looking at the similarities and differences between jobs and pay that effect the young and old, and between men and women. I will also be looking at other aspects which could affect people's Work and Pay, or might be caused by it. To do this, I will be looking at both Primary and Secondary information, separately and together, to make as complete a comparison between them as I possibly can. I obtained the information for my Secondary data from within "Fact File 1998", which gave me the opportunity to choose several different types of data for comparison. This is a publication produced every year by the Government. It provides statistical data on a wide range of categories, including jobs and pay, by gender and age. It also includes data on car and house ownership, holidays and a wide range of other information which was outside the scope of my coursework investigation. I obtained my Primary data from members of the public, who were using "The Galleries" shopping arcade in Wigan. I collected the data by means of a sample questionnaire, which was carried out on the afternoon of Wednesday 29th September 1999. I will present my Secondary Data by means of line graphs, bar charts, pie charts, box and whisker diagrams and scatter diagrams. I will obtain Spearman's Correlation Coefficients and Mean and Standard Deviations.