Previous studies have detected different variables influencing the attitude towards people suffering form depression. Dr McAllister-Williams (2008) states that the depression causes much confusion because “it is often difficult to tell the difference between feeling gloomy and having a depressive illness”. For some people depression is a serious, mental illness. For others – it is just an excuse. In December 2001 attitudes towards depression were measured. The study was a quantitative survey which was conducted by MORI (part of the Ipsos Group). Over 2000 people were interviewed (all aged over 15). Vize (1993) noticed that the results showed that the majority of people interviewed believe that depression is an illness, and that anyone can suffer from it. The most common perceived causes are personal and social, although one third think that depression can be caused by 'biological changes in the brain'. Over 90% of people interviewed consider that people suffering from depression should be offered counseling, whereas only 16% feel that they should be offered antidepressants. There is no significant difference in this view across different sexes, ages or social classes, or between those who had suffered from depression and those who had not. Surprisingly, there is a view across all subgroups that antidepressants are addictive, with an overall 78% subscribing to this view (and 87% believing that tranquillisers are addictive). 62% of participants said spontaneously that they would consult their GP if they became depressed, and a further 17% agreed with this when prompted. However, a majority still felt they would
be embarrassed, and half would worry that the GP would regard them as 'unbalanced' or 'neurotic'; 58% felt that GPs just tend to give out pills for depression”.
Those shocking findings were the base of this study. As it has been couple of years since the survey was done. This study aims to develop a reliable and valid Likert scale questionnaire to test attitudes towards people afflicted by depression. The study also aims to find out if people’s attitudes towards depression changed since the last survey. It is hypothesized that people (regardless of whether they are psychology students or not) have more positive attitudes towards depression then they had in 1991. It is hypothesized that psychology students will show a positive attitude towards people suffering from depression (reflected in a high score) and non-psychology students will show a negative attitude towards people afflicted by depression (reflected in a low score).
Method:
Participants:
The study consisted with total of 40 students. These participants were divided into non psychology and psychology students, with 21 non psychology students and 19 psychology students. Each researcher had to hand the questionnaire out to ten participants: 5 psychology students and 5 non-psychology students. The same participants were used for both the first and second questionnaire.
Design:
This study was designed to develop a reliable and valid Likert attitude scale. The design was a mixed design. The independent variable is the groups and the dependent variable is the attitudes towards depression.
Materials:
Two questionnaires (see Appendix 2 and Appendix 3) were used as the source of analysis of attitudes toward depression. The first questionnaire contained 40 items with 20 positive and 20 negative worded items. Half of the items (for both questionnaires) were negatively worded and half positively worded. The example of item measuring negative attitude towards depression: “I think that depression may lead to suicide”. The example of item measuring positive attitude towards depression: “I think that depression is not very dangerous.” Questionnaires contained 3 different components of an attitude: cognitive component (e. g. “People suffering depression are sad and suicidal” – a belief about a certain topic), emotional (affective) component (e. g. “I do not like spending my time with people who suffer from depression” – feelings about a certain topic) and behavioural component (e. g. “I would be ashamed if I suffer from depression” - the action tendency towards a topic). The structure of the questionnaire included more behavioural and cognitive aspects of attitudes towards depression than the affective items. A grid (see Appendix 1) was used to incorporate all of these aspects.
Procedure 1:
A 40 item questionnaire was initially made after all researchers agreed upon the topic of depression. Each researcher developed 10 questions. The questionnaire was handed out to 40 participants. Each researcher handed out a questionnaire to 10 participants. After collecting all questionnaires back the results were analyzed. When creating the questionnaire on depression many factors had to be taken into consideration. The process of creating the questionnaire involved the group comprising 40 questions to incorporate the behavioural, cognitive and affect aspects of attitudes towards depression. The Likert scale was used to score the answers given. The reason the Likert scale was used was because it is simple to construct, easy for participants to answer, likely to produce a highly reliable scale and also allows several types of analyses. After coding positive and recoding negative responses the reliability and validity of the first questionnaire was assessed using face validity and the reliability analysis test. As a result 18 weak items were deleted from the 40 item questionnaire.
Procedure 2:
The second questionnaire contained 22 remaining items and was handed to the same participants. At first the items in the second questionnaire were recorded to make sure that all the items related to the attitude being measured. The reliability test was run again to test-retest reliability of the items. Test-retest assesses participants whether score similarly over time on the measure. Another analysis was carried out to retest reliability of the questionnaire and finally the criterion related validity of the questionnaire was assessed. According to “Writing Guides Reliability and Validity” the criterion related validity “is used to demonstrate the accuracy of a measure or procedure by comparing it with another measure or procedure which has been demonstrated to be valid”.
Results 1:
Initial Cronbach’s alpha from first questionnaire was α = 0.76. After deleting 18 items (questions) it raised up to α =0.93. Cronbach’s alpha is not one of statistical tests but it is a coefficient of reliability. The Cronbach’s alpha shows how well the questionnaire items measure the attitudes of both psychology students and non-psyhcology students towards depression. With Cronbach’s alpha above 0.7 the scale was claimed as reliable.
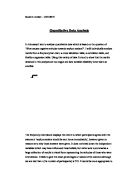
Results 2:
In results 2 the Cronbach’s alpha from the second questionnaire was too low (α = 0.53) and after removing seven of questions (elements) it raised up to α = 0.74. With was very important for increasing the internal consistency of the scale. By analyzing items and removing weak questions (items) Cronbach’s α was increased. Also the mean inter-rater items correlation was too low (r=0.05) and even after removing seven of questions (elements) it was still too low (r=0.16). Correlating inter-rater items was appropriate because the measure was a continuous one. Although, this report was expected to achieved correlations of 0.2-0.4.
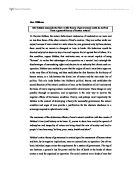
Table 1: Mean (±SD) scale scores for psychology and non- psychology students for both administrations of the questionnaire.
As the table shows there was no difference between psychology students’ attitudes towards depression and non-psychology students’ attitudes towards depression. Both groups showed quite a negative attitude towards depression.
The analysis of Pearson’s correlation showed that the scale was not reliable over the time.
(r (37) = -0.53, p<0.001)
The scale was not valid as well.
(t (37)=1.53, p>0.05)
Those results show that the aim of this study was not met and the attempt to develop a reliable and valid questionnaire to test the difference in attitude towards depression between two groups: psychology students and non-psychology students failed.
Discussion:
This study did not prove the hypothesis stating that psychology students will show a positive attitude towards people suffering from depression (reflected in a high score) and non-psychology students will show a negative attitude towards people afflicted by depression (reflected in a low score). There was no significant difference between psychology student’s responses and non-psychology student’s responses.
The attempt to create a reliable and valid questionnaire failed. The findings of this research raise the question whether the Likert Scale is a good instrument for measuring attitudes. According to Gal and his colleagues (1994) “Likert-type scales reveal little about the causes for answers and it appears they have limited usefulness”. Helgeson (1993) points two major problems: “lack of conceptual clarity in defining attitudes and technical limitations of the instrument used to assess attitude'.
Likert scale is also unable to “provide any kind of diagnostic information that shows underlying issues of concern to the individual respondents” (Page-Bucci, 2003).
But strengths of the Likert scale were found as well. Robson’s opinion that the Likert scale “can look interesting to respondents and people often enjoy completing a scale of this kind” was verified. All of researchers found that they did not look for participants for a very long time. For a participant the study using a Likert scale looks easy to complete and non-time consuming. Also Neuman (2000) confirms that “the simplicity and ease of use of the Likert scale is its real strength”.
As this study was based on students’ responses it is important to consider the interference and usability as students are often asked to complete many questionnaires about different topics. The hypothesis of this study stated that psychology students should have more positive attitude towards people suffering from depression as due to their knowledge about depression should understand them better. But the study proved that despite hours of lectures dedicated to depression, psychology students showed no better understanding and attitude towards the topic then non-psychology students.
Using different groups of participants should be considered in future studies of attitude towards depression. More time should be spent developing a reliable and valid questionnaire and appropriate and systematic procedures in questionnaire development, testing and evaluation should be followed.
References:
Allport, G. W. (1935) ‘Attitudes’. In: Murdhinson, C. M, eds., A handbook of socialpsychology. Worcester, Mass: Clark University press, pp.788 - 844.
Cronbach, L. J. (1951) ‘Coefficient alpha and the internal structure of tests’. Psychometrika, 16, pp.297-334.
Fishbein, M. and Ajzen, I. (1975) Belief, Attitude, Intention and Behaviour: An Introduction to Theory and Research. London: Addison-Wesley.
Gal, I. and Ginsburg, L. (1994) ‘The Role of Beliefs and Attitudes in Learning Statistics: Towards an Assessment Framework’. Journal of Statistics Education, 2.
Gay, L. (1996) Educational Research: Competencies for Analysis and Application. New Jersey: Prentice Hall.
Gross, R. (2001) Psychology: The Science of Mind and Behaviour. London: Hodder and Stoughton.
Helgeson, S. L. (1993) ‘Assessment of Science Teaching and Learning Outcomes. Monograph 6’. National Center for Science Teaching and Learning, Ohio State University.
Joppe, M. (2000) ‘The Research Process’. [online] Available at: <http://www.ryerson.ca/mjoppe/rp.htm> [Accessed on 14th April 2009]
Likert, R (1932) 'A Technique for the Measurement of Attitudes'. Archives of Psychology, 140.
McAllister-Williams, H. (2008) ‘Depression’. [online] Available at: <http://www.netdoctor.co.uk/diseases/facts/depression.htm> [ Accessed on 12th April 2009]
Neuman, W. L. (2000) Social Research Methods: Qualitative and Quantitative Approaches. USA: Allyn & Bacon.
Page-Bucci, H. (2003) ‘The value of Likert scales in measuring attitudes of online learners’. [online] Available at: <http://www.hkadesigns.co.uk/websites/msc/reme/likert.htm> [Accessed on 12th April 2009]
Rokeach, M. (1968) Beliefs, Attitudes, and Values: A theory of Organizational Change. San Francisco: Jossey-Bass.
Triandis, H. (1971) Attitude and attitude change. New York: Wiley.
Uebersax, J. S. (2006) 'Likert scales: dispelling the confusion'. Statistical Methods for Rater Agreement website. [online] Available at: <http://ourworld.compuserve.com/homepages/jsuebersax/likert2.htm.> [Accessed on 14th April 2009]
Vize, C. M. (1993) ‘Defeat Depression Campaign’. Attitudes towards depression’. Psychiatric Bulletin, 17, pp.573-574.
Appendices:
Appendix 1 – Table shows the question generator grid used to create initial 40 items
Appendix 2 – Table shows the 40 item initial questionnaire
Appendix 3 – The table shows 22 item questionnaire with their original numbers from the first questionnaire
Appendix 4 – Table shows the internal reliability analysis of the second questionnaire
Appendix 5 – Table shows the internal reliability analysis of the second questionnaire after deletion of further 7 items
Appendix 6 – Table shows the summary item statisctics of 15 final items and the item – total statistics
Appendix 7 – Table shows test – retest reliablity of the created scale
Appendix 8 – Table shows difference in attitudes between psychology and non – psychology students (criterion – related validity