How to detect earthquakes:
Seismology:
The science of earthquakes, involving observations of natural ground vibrations and artificially generated seismic signals, with many theoretical and practical ramifications. A branch of geophysics, seismology has made vital contributions to understanding plate tectonics; the structure of the earth's interior; the prediction of earthquakes; and is a valuable technique in mineral exploration.
History of Earthquake Study:
Questions regarding the nature of earthquakes have occupied the minds of people living in earthquake-prone areas since ancient times. Some of the ancient Greek philosophers attributed quakes to subterranean winds, whereas others blamed them on fires in the depths of the earth. In around AD 130 the Chinese scholar Chang Heng, reasoning that waves must ripple through the earth from the source of an earthquake, constructed an elaborate bronze vessel to record the passage of such waves. Eight balls were delicately balanced in the mouths of eight dragons placed around the circumference of the vessel; a passing earthquake wave would cause one or more of the balls to drop. Earthquake waves were observed in this and other ways for centuries, but more scientific theories as to the causes of quakes were not proposed until modern times. One such concept was advanced in 1859 by the Irish engineer Robert Mallet. Perhaps drawing on his knowledge of the strength and behaviour of construction materials subjected to strain, Mallet proposed that earthquakes occurred “either by sudden flexure and constraint of the elastic materials forming a portion of the earth's crust or by their giving way and becoming fractured”. Later, in the 1870s, the English geologist John Milne devised a forerunner of today's earthquake-recording device, or seismograph (Grk., seismos, “earthquake”). A simple pendulum and needle suspended above a smoked-glass plate, it was the first instrument used in seismology to allow discrimination of primary and secondary earthquake waves. The modern seismograph was invented in the early 20th century by the Russian seismologist Prince Boris Golitzyn. His device, using a magnetic pendulum suspended between the poles of an electromagnet, ushered in the modern era of earthquake research.
Earthquake Prediction:
Attempts at predicting when and where earthquakes will occur have met with some success in recent years. At present, China, Japan, Russia, and the United States are the countries most actively supporting such research. In 1975 the Chinese predicted the magnitude 7.3 quake at Haicheng, evacuating 90,000 residents only two days before the quake destroyed or damaged 90 per cent of the city's buildings. One of the clues that led to this prediction was a chain of low-magnitude tremors, called foreshocks, that had begun about five years earlier in the area. Other potential clues being investigated are tilting or bulging of the land surface and changes in the earth's magnetic field, in the water levels of wells, and even in animal behavior. A new method under study in the United States involves measuring the build-up of stress in the crust of the earth. On the basis of such measurements the US Geological Survey, in April 1985, predicted that an earthquake of magnitude 5.5 to 6 would occur on the San Andreas Fault, near Parkfield, California, sometime before 1993. Many unofficial predictions of earthquakes have also been made. In 1990 a zoologist, Dr. Iben Browning, warned that a major quake would occur along the New Madrid fault before the end of the year. Like most predictions of this type, it proved to be wrong.
Intensity Scales:
Seismologists have devised two scales (shown above) of measurement to enable them to describe earthquakes quantitatively. One is the Richter scale—named after the American seismologist Charles Francis Richter—which measures the energy released at the focus of a quake. It is a logarithmic scale that runs from 1 to 9; a magnitude 7 quake is 10 times more powerful than a magnitude 6 quake, 100 times more powerful than a magnitude 5 quake, 1,000 times more powerful than a magnitude 4 quake, and so on. An estimated 800 quakes of magnitudes 5 to 6 occur annually throughout the world, in comparison with about 50,000 quakes of magnitudes 3 to 4, and only about one earthquake of magnitudes 8 to 9. Theoretically, the Richter scale is an open-ended one, but until 1979 an earthquake of magnitude 8.5 was thought to be the most powerful possible. Since then, however, improvements in seismic measuring techniques have enabled seismologists to refine the scale, and 9.5 is now considered to be the practical limit. On the basis of the newly refined scale, the magnitude of the 1906 San Francisco earthquake has been revised from 8.3 to 7.9, while the Alaskan earthquake of 1964 has been upgraded from 8.4 to 9.2. The other scale, introduced at the turn of the 20th century by the Italian seismologist Giuseppe Mercalli, measures the intensity of shaking with gradations from I to XII. Because seismic surface effects diminish with distance from the focus of the quake, the Mercalli rating assigned to the quake depends on the site of the measurement. Intensity I on this scale is defined as an event felt by very few people, whereas intensity XII is assigned to a catastrophic event that causes total destruction. Events of intensities II to III are roughly equivalent to quakes of magnitude 3 to 4 on the Richter scale, and XI to XII on the Mercalli scale can be correlated with magnitudes 8 to 9 on the Richter scale.
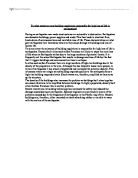
Seismograph The Fingerprint of an Earthquake:
A seismograph produced this record of a California earthquake measuring 5.5 on the Richter scale. The finger points to a heavy sweep on the seismogram created by the seismograph’s needle, which is designed to respond to horizontal or vertical vibrations—but not both. The machine cannot record both kinds of waves because the different orientation of the wave types requires separate balance systems (picture on the next page).
Finding the epicentre of an earthquake:
To identify the interior of the earth with ‘echo sound’ we must be able to locate exactly were the earth occurred.
The epicentre of a particular earthquake can be located by using the ‘LAG-TIME’. Which is the time delay between the P Wave reaching the Seismometer and the S wave reaching the seismometer. In the earths crust the mean velocity of the P Waves is 6.1 km/s, whilst for S Waves it is 4.1 km/s.
It would take the P waves about 16 seconds to travel 100 km, whereas S Waves would take about 24 seconds to travel the same distance. There the P Waves would arrive at the seismometer 8 seconds before the S Waves if the Epicentre were 100 km away. This means that the Lag-Time is 8 seconds, and also that for every second of Lag-Time the epicentre is 12.5 km away (i.e., 100/8 = 12.5). If you have the lag times from three seismometers, then you can work out the position of the epicentre.
For Example, if you look at the three seismograms that you are given, then you can see that the lag times are as follows;
A:24 seconds.
B:48 seconds.
C:28 seconds.
By Multiplying these by 12.5, you can workout the distance of each of the seismometers from the epicentre;
A:24x12.5 = 300 km
B:48x12.5 = 600 km
C:28x12.5 = 350 km
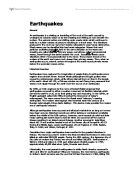
On a globe or a scale map you can then draw a circle of radius 300 km for A, 600km for B and 350 km for C. The point where the three circles cross each other is the epicentre. The principle is shown on the map below.