Der Handschuh.
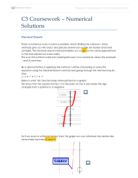
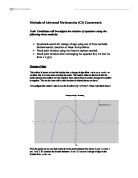
Methods of Advanced Mathematics (C3) Coursework. Task: Candidates will investigate the solution of equations using the following three methods: * Systematic search for change of sign using one of three methods: decimal search, bisection or linear interpolation. * Fixed point iteration using the Newton raphson method. * Fixed point iteration after rearranging the equation f(x) = 0 into the form x = g(x) Change of Sign This method is based on how the function has a change of sign either +ve to -ve or -ve to +ve on either side of a route when crossing the x-axis. This method relies on this fact to find the points between the positive and the negative value where there is another change from positive to negative. This can be done until a useful number of decimal places are found. To investigate this method I plan to use the function f (x) = x^3-5x+1. When I plot this it shows: From the graph we can see that routes lie on the x-axis between the values -3 and -2, 0 and 1 and 1 and 2. If I consider the function between -3 and -2 I can see I change of sign on the function from -ve to +ve. -6 -183 -5 -97 -4 -41 -3 -9 -2 5 -1 7 0 3 -1 To home in on a more accurate answer I need to investigate the decimal places between -3 and -2 x f(x) -3 -9 -2.9 -6.889 -2.8 -4.952 -2.7 -3.183 -2.6 -1.576 -2.5 -0.125 -2.4 .176 -2.3 2.333 -2.2 3.352 -2.1

The Relationship Between Price, Date of Release/ Re-Release of a Sample of 52 Randomly Selected Films
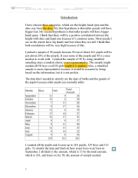
The Relationship Between Price, Date of Release/ Re-Release of a Sample of 52 Randomly Selected Films The title of my investigation is 'The Relationship Between Price, Date of Release/ Re-Release of a Sample of 52 Randomly Selected Films. As you can interpret from this title, I am going to investigate to see if the Price and Release/ Re-Release a set of selected feature length films is effected by I will also be seeing if there is a relationship between the length of the title and the film and also to see if modern films are longer than earlier ones. I have chosen to investigate into this topic because I am interested in Films and I am currently studying Media, And I wish to find out if an audience after they have finished watching a film how popular the film is on video, In short, my aim for this investigation is to find if here is a relationship between the price of a video and the time it was released / re-released. I planned this coursework for future reference so I could add the information to my media coursework as a tested fact. To determine a population for my course-work, I am going to use the HMV superstore Internet site to search for my sample of films. This film site is split up into categories corresponding to letters of the alphabet; therefore there are a total of 26 categories as there is 26 letters of the alphabet. Each category contains roughly 500 films

Investigate if there is any correlation between the GDP per capita ($) of a country and the life expectancy at birth (years).
Aim: - My aim is to investigate if there is any correlation between the GDP per capita ($) of a country and the life expectancy at birth (years). The GDP is the gross domestic product or value of all final goods and services produced within a nation in a given year. GDP dollar ($) estimates are derived from purchasing power parity (PPP) calculations. The GDP per capita ($) shows GDP on a purchasing power parity basis divided by population. The life expectancy at birth shows the average number of years to be lived by a group of people born in the same year, if mortality at each age remains constant in the future. It shows the life expectancy on average for the total population for male and females. Life expectancy at birth is also a measure of overall quality of life in a country and summarizes the mortality at all ages. The reason for doing this investigation is that I have seen a lot of documentaries and read a lot of articles in the newspaper which have talked about how the gap between rich and poor has increased. This has led to a poorer quality of life in developing countries. So I wanted to see if there was any link between how rich a country is per person and what on average is the life expectancy for a person is in that country. This will help me get a better understanding of how rich a country is how much it affects the quality of life. This is the reason why

I am investigating how well people estimate the length of a line and the size of an angle.
I am investigating how well people estimate the length of a line and the size of an angle. I am going to compare the following: * Year 7 compared to year 10 (Boys and girls) in estimating the size of an acute angle. * Girls compared to boys (Years 7 and 10) in estimating the length of a short line. I am going to compare these two because it is a very wide range of data. I am going to sample 40 people for each investigation, For example: * 40 people from year 7 and, * 40 people from year 10. A questionnaire has been circulated to a variety of people in set 1-5 and year 7-sixth form. The questionnaire includes questions, such as: * Estimate the length of this line * Estimate the size of this angle * Estimate the length of this squiggle For Investigation 1 'Year 7 compared to year 10 in estimating the size of an acute angle' My hypothesis is that a larger amount of year 10 will be better at estimating the size of an angle than year 7. I think that more people from year 10 will be better at estimating the size of an angle because they have been in education longer and are more advanced at maths, while year 7 will be less advanced as they haven't been in education as long as year 10. For Investigation 2 'Girls compared to boys I estimating the length of a short line' My hypothesis is that girls will be better at estimating the length of a line and the size of
There are many measurements available to monitor changes in breathing capacity. One of the simplest measurements used by doctors and patients would be the peak flow meter
Peak flow measurement Introduction There are many measurements available to monitor changes in breathing capacity. One of the simplest measurements used by doctors and patients would be the peak flow meter. A peak flow meter is a "portable instrument that detects minute decreases in air flow, used by people with asthma to monitor small changes in breathing capacity"1. The peak flow meter has two parts, a mouth piece and a meter measured in litres per minute (L/min). This type of measurement is used for diagnosis and self-management; it is very cheap and easy to manage by the patient. But unfortunately it is not very accurate as the meter only measures in every 10 L/min. There will be a greater inaccuracy to smokers since they have greater damage in there bronchioles. A peak flow meter will help the patient to tell what is going on in his airways rather than guessing the way a patient feels, also it will help whether the patient needs to change his treatment. Asthma is a "medical condition which makes breathing difficult by causing by causing the air passages to become narrow or blocked"2. The tightness of the air ways can cause one or more of the following symptoms: * Wheezing * Coughing * Shortness of breath * Chest tightness The narrowing of air passages is caused by airway inflammation (airways in lungs become red, swollen and narrow). Unfortunately the cause of
I am going to design and then carry out an experiment to test people's reaction times, and therefore test my initial hypothesis.
Mathematics Statistics Coursework I am going to design and then carry out an experiment to test people's reaction times, and therefore test my initial hypothesis. Initial Hypothesis: Some people have faster reaction times than others To design my investigation, I first need to carry out a preliminary test, to see what variables there are, and how I will control them. To test reaction times, I dropped a special piece of card, with numbers along it recording how many hundredths of a second it takes for the person to drop it. From the information gained by this test, I set my main rules. Variable How I will control it Distance between fingers and ruler Ruler must be parallel to finger and thumb with a 3cm gap. I decided on 3cm as this was the same width as the ruler. Weight of the ruler All the rulers used will be the same type, and therefore the same weight and shape. Health of participant Unfortunately, this cannot easily be controlled, though I presume that anyone ill would not be in school, and therefore not take the test. This means that hopefully everyone taking part will be quite healthy Where the measurement is read from I will make sure this is read from above the thumb Hand used to catch ruler (dominant/non-dominant) I will test the ruler five times on each hand Time of day I will do the test once in the morning and once in the afternoon, as I saw in my
Investigation into factors affecting growth
Investigation into factors affecting growth Introduction In this project I will be investigating the factors that effect growth such as Male/Female, Age, D.O.B, Height, Foot length, Hand span, Wrist circumference and Pulse. For my population I will be using a sample of data from the "Census at schools project (phase 3)", which is the most recent. I requested a random sample size of 200 from the "Census at schools project (phase 3)". The fields of data in the sample are: Male/Female, Age, D.O.B, Height, Foot length, Hand span, Wrist circumference and Pulse. I think that this data is likely to be true and fairly unbiased, even though it is secondary data, I am assuming that nobody except for the person that data applied to has tampered with it, but I can't be sure. This would make primary, but I have not collected the data myself, therefore I cannot tell if someone is lying or has given a spoof entry. I will be comparing some of the fields; Male/Female, Age, D.O.B, Height, Foot length, Hand span, Wrist circumference and Pulse, to see what links they have with each other, if any. Obviously a sample of 200 is to many for me so I have taken a smaller sample of 51 from the 200. This will be my population. I have chosen 51, because this makes it easy to find the median and the upper and lower quartiles (the 17th, 26th, 34th sample). To choose my population from the larger
males and females driving
Thomas Lock 10Z Maths GCSE Data Handling Coursework Summer 2005 "Do males perform better than females at the driving school?" Scenario: I am a business consultant brought in to have a look at the performance of a driving school. I have been given the raw data which shows, in no particular order, how different students have got on in their driving tests. Introduction: This experiment has the aim of proving the hypotheses (that I shall develop) by handling data and managing it effectively to instigate realistic results. The hypotheses will be based upon test results from a driving school. I am intending to explore the success of males and females in a driving school. I shall do this by testing the number of one hour lessons and the number of errors in a random sample of 30 males and 30 females. I aim to use this data to test several hypothesises. Data: The data which I will be using in this investigation has been gathered from an unknown driving school. I am acting as a business consultant brought in to have a look at the performance of said driving school. The raw data which I have been given is in list form and provides me with the performance of 239 students, of both sexes and includes: * The number of one hour lessons before successful test. * The total number of minor errors in test(s) taken. * The name of the

GCSE Math Coursework: Triminoes
GCSE Math Coursework INTRODUCTION Triminoes is a game similar to dominoes. The game is played using triangular pieces of card. Each card has three numbers on it. Instead of drawing the triangles I will write the three numbers in brackets below. E.g. (000) (001) (002) (011) (012) (022) (111) (112) (122) (222) The aim of this investigation will be to: . Investigate the relationship between the number of Triminoe cards in a set and the largest number used in a set. 2. Investigate the relationship between the sum of all numbers on a set of Triminoe cards and the largest number used on the cards. PLANNING These are some of the formulas I will be using in order to complete the tasks: f (n) =an+b (Linear equation) f (n) =an2+bn+c (Quadratic equation) f (n) =an3+bn2+cn+d (Cubic equation) f (n) =an4+bn3+cn2+dn+e (Quartic equation) METHOD . First I am going to the number 0 and find out how much different possibilities I can make with the one number, this is obviously one. 2. I will then try two numbers 0 and 1 and find out how much different possibilities I can make with the two numbers. 3. I will continue to do this until I feel I have used enough numbers. 4. On each set of data I will record the largest number used, the sum of all the cards added together, and the number of cards used. 5. I will then make a results table. 6. I will collect the

The aim of this investigation is to gain statistical information to show authorship of a text.
AS Mathematics: (AQA) Statistics Coursework DESIGN Introduction: The aim of this investigation is to gain statistical information to show authorship of a text. For this investigation, I will use two pieces of text in order to investigate authorship. In order for the investigation to be valid, the two pieces of text I need to use should have a different theme attached to them. By theme, I mean they need to be different in a broad way i.e. different genre, different age readers. I had a number of different texts to compare but I decided to use one adult text and one child text as this will give me a more obvious variation and expectation. For this investigation I will be calculating the mean of the distribution for both populations. I will then be able to calculate the standard deviation and variance, and I will be using the unbiased estimator for both populations. I will calculate the standard error and confidence intervals for both populations. My data will be represented using frequency distribution tables and these can show the trends of a frequency distribution graph. The normal distribution diagrams will also be used for the confidence intervals representation. Population: In a statistical enquiry, you often need information about a particular group. This group is known as the POPULATION and it could be small, large or infinite. The population for my