Mayfield High School Maths Coursework
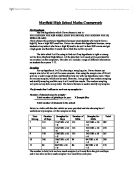
Mayfield High School Maths Coursework My Hypothesis My first hypothesis which I have chosen to test is:- THE HIGHER THE KS2 RESULTS OF STUDENTS, THE HIGHER THE IQ RESULTS ARE. I have chosen this particular hypothesis because many students who tend to have a high IQ, have a high KS2 result too. I have also chosen this hypothesis because, many students at my school who have a high IQ tend to do well in their KS2 exams and get a high grade and therefore I would like to find this out for my-self. The data which I will be using to find out if my hypothesis is right or wrong will be from Mayfield High School. All the data that I will need will be provided for me at school on the computers. This data will include a range of different information on students from years 7-11. Sampling For my hypothesis I will be choosing a sampling size. I have chosen my sample size to be 50, as it will be more accurate. Also using the sample size of 50 will give me a wider range of data and therefore help me with my hypothesis more. There are various samples, which can be used. However, I am going to use random sampling and stratify sampling and this way it will avoid bias results. The random sampling will pick out my data in any order. The below formula is used to stratify my samples. The formula that I will use to work out my samples is:- Number of students used in sample= Total

Find out whether my theory that year 10 pupils are better at estimating the length of a stick than year 7 pupils.
Maths Coursework Statistics Hypothesis- In my investigation I plan to find out whether my theory that year 10 pupils are better at estimating the length of a stick than year 7 pupils. Plan- In my investigation I plan to use secondary data gathered from both year 7 and year 10 pupils, which I will then do a random sample of which will be used to find the mean, median, mode, range as well as standard deviation which I will then put into groups and frequency tables to compare and from this I will hopefully be able to come to a conclusion. Aim- I am hoping to find if the statement that year 10 pupils are better at estimating length than year 7 pupils is true and find different ways of proving this. I am hoping to find a mean for the both groups to compare where I will hope to find that the year 10 mean is closer to the actual value (1.36m) than year 7 pupils and this I hope will help me come to a fair conclusion. I am also hoping to find the standard deviation for both groups and hope to find that year 10 pupils will have a smaller standard deviation than the year 7 pupils because I believe it is more reliable because it shows less range which means all of the pupils have answered fairly similarly because a wide range means people where miles away with their guessing. Sampling- I will number each piece of raw data and then I will use the random search on my calculator. I will
data handling
Introduction I have chosen three categories, which are the height, hand span and the shoe size from the data. My first hypothesis is that taller people will have bigger feet. My second hypothesis is that taller people will have bigger hand spans. I think that there will be a positive correlation between the height with shoe and hand size because it's common sense. Most people I see on the streets have big hands and feet when they are tall. I think that both correlations will be very high because of this. I picked a sample of 50 people because 50 out of about 261 pupils will be just about 20% of the people. It uses some of the people and 50 is a nice number to work with. I picked the sample of 50 by using stratified sampling since a random choice is not representative. The sample might contain all 50 boys or all 50 girls might it is random. Also, a stratified sample is more representative because it would be accurate by being based on the information, but it is not perfect. The data that I needed to stratify are the date of births and the gender of the pupils because older pupils are normally taller. Months Boys Girls Total Amount September 1 9 20 October 4 6 20 November 7 3 20 December 9 7 26 January 3 6 9 February 7 0 27 March 5 7 32 April 9 8 7 May 9 1 20 June 2 3 25 July 9 6 25 August 4 6 0 29 32 261 I counted

decimal search
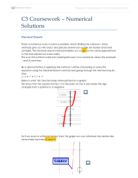
Introduction In maths equations can be solved using various methods. A very common and efficient method in solving equations is algebraically. But not all equations can be solved algebraically; these equations must be solved using numeric methods. I will study three specific numeric methods on different equations. ~ Change of sign, decimal search process. ~ Newton-Raphson method. ~ Re-arrangement method. I will be testing the numeric methods with separate equations which cannot be solved algebraically. I will also apply all of the methods to one of the equations and check if all the methods give me the same value for the root I want to find. Change of Sign, Decimal Search To find the root of the equation f(x) = 0 means finding values of x for the graph y = f(x). The change of sign method works on the bases that the y = f(x) graph changes signs when it crosses the x-axis. e.g. y = f(x) The sketch above shows that there is a root between the interval [b , c] and the curve of y = f(x) crosses the x-axis and changes its sign from negative ( - ) to positive ( + ), and at the interval [a , b] f(x) curve crosses the x-axis changing its sign from positive ( + ) to negative ( - ). An initial interval of where a root lies can be obtained from a sketch. By taking the values of the initial interval we can increase the value of x by increments of 0.1 within the

Critical Path Analysis.
CRITICAL PATH ANALYSIS Introduction In projects made up of various activities where 'time is of the essence', the duration of each activity needs to be managed. Certain activities run simultaneously and some must precede others. If all activities are listed with their duration and preceding activities these can be networked visually. Earliest and latest times for each event (starting and finishing times for activities) can be established till the last activity. This saves time making the project as efficient as possible. Certain activities when delayed will increase the time of the entire project. These form a path known as the 'critical path' and show those 'critical activities' that have no spare time. All these steps make up the Critical Path Analysis. After analysis of the network a cascade chart can be formed with a corresponding resource histogram showing the number of workers throughout the project. The floats can be re-arranged to produce a levelled histogram where the number of workers are levelled out throughout the project. These are helpful in mall projects like cooking where they may only be two cooks to carry out the whole project ranging to large-scale projects like constructing a shopping centre. I am required to cook a meal consisting of 21 activities. This includes the preparing and clearing away of the meal. I am deciding to allocate 'get
C3 COURSEWORK - comparing methods of solving functions
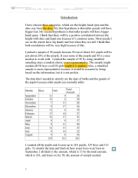
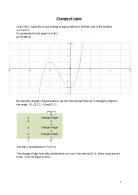
Change of signs First of all, I would like to use change of signs method to find the roots of the function y=x³+3x²–3. It is presented by the graph of y=f(x) y= x³+3x²–3 By using the change of signs method, we can find out that there are 3 changes of signs in the range [-3, -2], [-2, -1] and [0, 1] x³+3x²–3 -3 -3 Change of sign -2 1 -1 -1 Change of sign 0 -3 Change of sign 1 1 2 17 The first 2 calculations of x³+3x²–3: The change of sign here tells us that there is a root in the interval [0, 1], where roots are not trivial. (f (x) not equal to zero) Roots to f(x) =0 y= x³+3x²–3 x x³+3x²–3 0 -3 0.1 -2.969 0.2 -2.872 0.3 -2.703 0.4 -2.456 0.5 -2.125 0.6 -1.704 0.7 -1.187 0.8 -0.568 Change of sign 0.9 0.159 1 1 The change of sign here tells us that there is a root in the interval [0.8, 0.9]. x y=x³+3x²–3 0.8 -0.568 0.81 -0.50026 0.82 -0.43143 0.83 -0.36151 0.84 -0.2905 0.85 -0.21838 0.86 -0.14514 0.87 -0.0708 Change of sign 0.88 0.004672 0.89 0.081269 0.9 0.159 The change of sign here tells us that there is a root in the interval [0.87, 0.88]. x y=x³+3x²–3 0.87 -0.0708 0.871 -0.0633 0.872 -0.05579 0.873 -0.04827 0.874 -0.04074 0.875 -0.0332 0.876 -0.02565 0.877 -0.01809 0.878 -0.01051 0.879 -0.00293 Change of sign 0.88 0.004672 The change of

Newton Raphson Method for Solving 6x3+7x2-9x-7=0
Page of Newton-Raphson method The equation I am going to Solve is 6x3+7x2-9x-7=0 Newton-Raphson is a fixed point iteration method. The first approximation has to be near the root so the method will work. A tangent has to be drawn at the first point y=f(x) and when it touches the x-axis this gives another root. The tangent cuts the second point on the curve. This process is then repeated. The Newton Raphson method uses an algebraically formula to calculate the value of roots. . The formula is first worked out by the gradient of the tangent there are steps of algebra to get to the final equation. Autograph will do these calculations automatically. f `(xn) = (x1-x2)f `(x1) = f(x1) x1-x2 = x2 =x1 - f(x) is negative The root lies between 1.1155 and 1.11555 .11545 1.1155 1.11555 f(1.11545) = -0.002199645 f(1.1155) = 0.00020309 f(1.11555)= 0.000701867. X = 1.1155 Error Bounds = ±0.00005 Solution bounds = (1.11545≤ x ≤1.11555). n xn f(xn) f `(xn) xn+1 0 x0 = 1 f(x0)= -3 f '(x0)= 23 x1 = 1.1304 x1 = 1.1304 f(x1) = 0.4376 f '(x1) = 29.826 x2 = 1.1157 2 x2 = 1.1157 f(x2) = -0.000748 f '(x2) = 29.015 x3 = 1.1155 Solving 6x3+7x2-9x-7=0 for

Maths Assignment - trigonometry, trend line, probability and calculus questions.
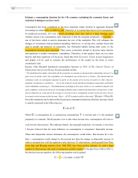
. Question: Trigonometry can be used to solve problems instead of constructing a scale diagram. A man leaves a point walking at 6kmh on a bearing of 80o. A cyclist leaves the same point at the same time on a bearing of 120o travelling at a speed of 17kmh. Calculate their distance apart after 4 hours using trigonometry. (6) Answer: Figure 01 As shown in the figure 01, let’s take ‘A’ as the starting point. After 4hrs the man is at point M and cyclist at point C Distance travelled by the man after 4hrs Distance travelled by the cyclist after 4hrs Now let’s consider the triangle Using the information in the question, the application of the Cosine rule would seem to be the best choice for this problem as we are given more angles than distances. After 4hrs distance between the cyclist and man 2. Question: If experimental data doesn’t produce a straight trend line it doesn’t mean there isn’t a relationship. The use of software packages can allow quick and accurate testing of data to different trend lines so that a suitable relationship can be found if it exists. Atmospheric pressure P is measured at varying altitudes h as shown below. The data is thought to be of the exponential form p = aekh Altitude 500 1500 3000 5000 8000 Metres Pressure 73 68 62 54 43 cm a) Using Excel verify this is true.
The open box problem
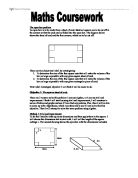
The open box problem An open box is to be made from a sheet of card. Identical squares are to be cut off at the corners so that the card can be folded into the open box. The diagram below shows the sheet of card and the four corners, which are to be cut off. There are two objectives I shall be investigating: . To determine the size of the four square cuts that will make the volume of the box as large as possible with any given square sheet of card. 2. To determine the size of the four square cuts that will make the volume of the box as large as possible with any given rectangular piece of card. First I shall investigate objective 1 as I think it will be easier to do. Objective 1: The square sheet of card. There are 2 ways to solve this problem: I can use algebra, or I can use trial and improvement. I think I will start by using trial and improvement; I will construct a series of tables and graphs and see if I can find any patterns. If so, then I will be able to come up with a hypothesis, which I can then test to see if I can solve this first objective. Then I will attempt to solve the same problem using algebra. Method 1: Trial and improvement To do this I need to make up some dimensions and then apply them to the square. I will choose the dimensions 6x6 to start with. I will call the length of the square cuttings x. The second drawing shows the open box with the

The Gradient Function
The Gradient Function Aim: To find the gradient function of curves of the form y=axn. To begin with, I should investigate how the gradient changes, in relation to the value of x. Following this, I plan to expand my investigation to see how the gradient changes, and as a result how a changes in relation to this. Method: At the very start of the investigation, I shall investigate the gradient at the values of y=xn. To start with, I shall put the results in a table, but later on, as I attempt to find the gradient through advanced methods, a table may be unnecessary. As I plot the values of y=x2, this should allow me to plot a line of best fit and analyze, and otherwise evaluate, the relationship between the gradient and x in this equation. I have begun with n=2. After analyzing this, I shall carry on using a constant value of "a" until further on in the investigation, and keep on increasing n by 1 each time. I shall plot on the graphs the relative x values and determine a gradient between n and the gradients. Perhaps further on in the investigation, I shall modify the value of a, and perhaps make n a fractional or negative power. Method to find the gradient: These methods would perhaps be better if I demonstrated them using an example, so I will illustrate this using y=x2. This is the graph of y=x2. I will find out the gradient of this curve, by using the three methods -