Circuit Plan:
Plan: I will set up the circuit as shown above.
I will measure, using a multimeter set to measure in Ohms, the maximum resistance of the potentiometer, and set the resistance box to a resistance as close to that as the dials allow.
I will then fill the beaker with 2cm of water, measuring using a ruler, accurate to the nearest 1mm.
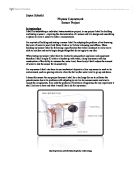
I will lower the ball and arm into the water until the ball is floating on the water, and I will then read off the potential difference and current.
I will repeat this process with depths of water increasing each time by 1cm.
I will repeat each reading three times in order to calculate an average for both voltage and current, and then for resistance.
I will then plot graphs of depth of water against voltage, and of depth of water against resistance in order to observe and analyse the accuracy of the sensor.
Interfering Effects:
- Volume of water changing as the potentiometer is removed. I will combat this by measuring (and, if necessary, changing) the depth of the wter before taking each reading
- Also, to make sure that all the readings are accurate and reliable I will measure the depth of the water in the beaker without the potentiometer in it, as this causes the water to appear deeper than it actually is because the potentiometer displaces some of the water.
Results:
I have also drawn two graphs, one plotting voltage against the depth of water and one plotting resistance against the depth of water. I have does this so I can see more easily the relationship between the two, and therefore evaluate more easily whether my sensor is suitable. I have also done this as it means it is easier for me to see what pattern my results follow and whether there are any anomalies.
From looking at my results in graph form I can see several large jumps between results and it is hard to tell whether these are part of the pattern or whether they have been caused by experimental error or are anomalies. Therefore I have decided that I will improve my evaluation of the sensor by using a more accurate way of measuring voltage and resistance. Also, having plotted the error bars, it shows that the accuracy of the experiment was, in the greatest instance, only slightly less than 2cm. As this is the minimum accuracy level I have specified for the sensor, I shall attempt the experiment again, using a Wheatstone Bridge, rather than a voltmeter.
The main problem with using a voltmeter is that it has an internal resistance which affects the readings it gives. By using a Wheatstone Bridge instead more accurate readings can be obtained as it compares the resistances of the resistors in the circuit with those within the Wheatstone bridge. The ammeter between the two pairs of resistors compares them by showing a current flowing if they are different. Therefore its internal resistance is irrelevant, as when the Wheatstone Bridge is balanced, there is no current flowing through it. It also has the advantage of not being affected by temperature changes as it does not measure individual resistances but makes a comparison.
I will use the same method for this experiment, but will set up the circuit incorporating the Wheatstone Bridge in place of the voltmeter. The new circuit will then look like this:
The other difference to my method will be that I will plot one graph of depth of water against the length of wire L1, rather than against the resistance of that wire. This is because the length of the wire is proportional to the resistance, and therefore the two graphs would have the same appearance.
Interfering Effects:
- As well as the two interfering effects already mentioned above, I will take into consideration the following:
- Wheatstone Bridge heating up and increasing in resistance. I will combat this by turning off the power supply when not taking readings.
Safety:
As well as general laboratory safety I will be especially careful in keeping water I am using and electricity apart, for although there is very little risk of a current flowing, there is still a chance; for example, I will do this by not working close to sinks and drying all spillages immediately.
Anomalies:
Table of anomalies –
The results in the “Anomaly” column all appeared to be anomalous when viewed with the other 2 repeats that I had carried out for that depth of water. Therefore I decided to repeat the experiment using those depths again so that I could attempt to get a result closer to the others that I had, which had appeared t follow a trend. It can be seen from the above table that for each repeat I carried out, the repeated value was closer to the other two that I previously had. In the main results table results which are a further repeat are marked with an asterisk. This, therefore, shows that the results were indeed anomalous, and that by repeating them my overall results are now more accurate. It is interesting that all but one of my eight anomalies appears in the third repeat of the experiment, which leads me to believe that there may have been a factor in this third repeat which affected many of the results, therefore causing these anomalies.
Accuracy:
In order that my readings were accurate I have taken three (minimum) readings for each resistance at the varying water depths. This enabled me to take an average reading at plot error bars (the highest and lowest readings for each point) on my graphs, which shows the overall accuracy of each point, and therefore how reliable it was – the smaller the error bar represents the smaller the range over which the readings varied, and therefore their increased accuracy.
Results:
Fitness for purpose:
In my initial experiment, the margin of error ranged between 0cm and 2.2cm, for the voltages, and between 0.3cm and 2.1 cm for the resistances. Having said, in my earlier context, that the sensor would need to be accurate to 2cm alterations in the level of water, I decided that this method was not fit for the purpose, and added a Wheatstone Bridge to make the sensor more accurate.
With the Wheatstone Bridge in the circuit the margin of error ranged from between 0.4cm and 2.9cm. Therefore, it appears that this method of carrying out the experiment can be even more unfit for the purpose – that is, to measure the depth of bath water accurate to 2cm.
There are several reasons why these results have a larger range for each depth than anticipated. As the rotary potentiometer measuring the depth of water works on a rotary basis, the amount of ping-pong ball in the water each time varies, as the ball rises in a circular motion rather than in a linear one. Also, reflecting the trend ther appears to be for the anomalous results to appear in the third repeat, the ball may not have been perfectly water-tight, and therefore it would have been possible for it to increase in weight due to water entering it. This would have made the ball heavier, and therefore it would have been less easy for the potentiometer to lift, so would not have rotated as much, thereby not changing the resistance as much as it should have done.
The response time of the sensor is almost instant to the changing depth of the water, and this would make it ideal for the job of measuring a continually rising water level of a bath, which needs to be monitored constantly and needs to alert the user as soon as the desired water level is reached, to prevent over-flowing.
The sensitivity of the sensor to the changes in water depth is high, shown by the definite negative correlation of the points on the graph, and the clear gaps between the resistances for each depth. This makes the sensor suitable for the job of measuring bath water as it needs to be sensitive to small changes in the water depth, of between 1 and 2cm. However, there does appear to be some element of random variation, particularly in the repeated sets of results, most likely to have been due to the causes above. Due to this random variation the high sensitivity is sometimes negated because the lowest resistance for one depth overlaps with the highest resistance for the next. Because of this, the sensor is not appropriate for use in the context of monitoring the depth of bath water, as it is not sensitive enough on a reliable level.
Due to the combination of these factors, it has been shown that although in terms of response time and sensitivity the sensor is appropriate to be used to measure the depth of bath water, in terms of accuracy and variation, it does not fit the criteria. Therefore, overall, the sensor is not fit for the purpose that I have tested it for – that of sensing the depth of bath water.