George Plant
Maths Coursework
In this piece of coursework I am going to explore the statement “the older a car is the cheaper it will be”. To do this I am going to be inspecting two hypotheses: “the older a car the more miles it would have done” and “the more miles a car has done the cheaper it will be”
To do this I have gathered the needed information on 40 cars, this would be the price when new, the price when used, the mileage and the age. The information was got from a used car sales place and to narrow the amount of cars information I have I will pick randomly from the list of around 200, I will randomly choose the information using the random number key on my calculator, I will the pick out the car number accordingly. Bellow is the information I will be working from:

Using the information above I am going to draw up some graphs that will shows the correlation between the 3 hypotheses, firstly being how the age affects the price:
The problem with the graph above is that the line of correlation is not as accurate and true as it could be, this is due to the outliers in the information that I used (circled in red).
To solve this problem I am going to draw the graph again but take out the outliers, this would give a better average and show more accurately the average ...
This is a preview of the whole essay
Using the information above I am going to draw up some graphs that will shows the correlation between the 3 hypotheses, firstly being how the age affects the price:
The problem with the graph above is that the line of correlation is not as accurate and true as it could be, this is due to the outliers in the information that I used (circled in red).
To solve this problem I am going to draw the graph again but take out the outliers, this would give a better average and show more accurately the average price that the cars drop per year.
The above graph shows the information in the first graph but without the outliers, the benefit in this is the change you get in the line of best fit and the equation that comes with it: y= -699.92x + 9070.7 shows us various information, the -669.92 shows us the gradient of the line, this tells that for every year a car gets older it will on average depreciate £699.92. The +9070.7 at the end of the equation shows us the point of where the line crosses the Y intercept, this shows us the average price that a new car of 0 years would cost. The negative correlation shows us proof of my first hypothesis, “the older a car is the cheaper it will be”
You could also use this line of best fit to see the average price of a car of a chosen age, you can do this by drawing a line up from the chosen age and when you hit the line of best fit draw the line left, as the red line above shows. The red line shows us that a car that is 6 years old would on average cost just under £4500.
However I believe that the above graphs could be improved if the data was not so scattered and that the graph was drawn on the average data. Instead of using the price of the car I will instead be using the proportion of value left in the car. This is a number between 0 and 1 and could be easily transferred into a percentage. To work out the proportion used below the calculation is:
Used Price
New Price = Proportion of Value left
Below is a table that shows us the age of the cars and the average proportion of value left. I worked out the average for all ages of car, the average is the information that I will use to draw a more accurate scatter graph to show how cars loose value with age.
Using the information above I am going to draw up a graph that will show the correlation between with how the age affects the price. Firstly I calculated the average proportion of the new price held for cars of the same age. For example, there are 8 cars in the sample that are 5 years old and the average proportion of price held for 5 year old cars is 0.423. This calculation does not include the effect of different mileage of cars of the same age. Unfortunately, the sample I used had no 1 year old cars so I couldn’t calculate the average for that age. The oldest cars in my sample were 10 years old.
The graph above didn’t have large numbers of cars of the same age so the average figure calculated could have been messed up by a single unusual value, or outlier. A very large sample would reduce the effect of outliers. First I drew a linear trendline but I noticed that it was not a good fit for new cars because new cars lose value quickly but then more slowly as they get older. An exponential trendline fits this better.
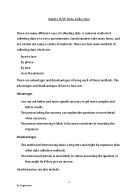
I am going to use my other to hypotheses to explore my first one in more detail, these being “the older a car the more miles it would have done” and “the more miles a car has done the cheaper it will be”. I feel that these two hypotheses will help explain the statement (“the older a car is the cheaper it will be”) and make it more understandable.
I will show the correlation between the age of a car and the miles it has done by drawing a graph:
The above graph shows a small positive correlation between the miles done and the price of a car, showing us the older a car is the more miles it would have done. We can also see from the equation that on average a car will do 1445.9 miles a year. As you can see the mileage in cars varies greatly and that the correlation is not very strong, this is because the outcome is due to the owner/previous owner of the car.
A significant factor that determines the used price of the car is the mileage the car has done and how much the starting price is. The best way of showing this is by working out the depreciation per mile. To do this I got my data; the new price, the used price and the mileage, and then created the formula below:
(NewPrice – UsedPrice)
Mileage = Depreciation per mile
I used this formula to work out how much money each of the cars I have been sampling drops in price per mile travelled. In my sample of cars on average a car would lose 65pence per mile travelled, that’s £650 every thousand miles. Below is an example (given on Ford Mondeo) for the formula above to show the depreciation per mile:
(18,045 – 11930)
10,000 = 0.61 (£)
If I wanted to do a graph to show how the value drops with mileage I would need more data. For example, I would need the price s of a number of cars of the same type and age but with different mileages.
I hope that my investigation has proved the 3 hypotheses correct.in my sample of 40 cars it s now clear to see that “ the older the car is the cheaper it will be” and that the important factors behind this are the amount of mile the car has travelled, and also the age. From the sample of cars that I have used we see that the average car drops £699.92 per year and would travel 1445.9 per year, and that there would be a loos of 61pence (£0.61) per mile travelled.