Mathematics Handling Data Coursework: How well can you estimate length?
Mathematics Handling Data Coursework: How well can you estimate length? Introduction A school teacher asks two sets of students to estimate the length, in metres and to two decimal places, of a 1.58 metre long stick, held up horizontally in front of them; this is to prevent pupils from comparing the stick to the teacher's height. 178 Year Eleven pupils and 173 Year Seven pupils are asked. Hypothesis I believe that the Year Eleven pupils will be more accurate in their estimation than those in Year Seven. This is because they are older, more knowledgeable at Mathematics and have also been estimating lengths for a longer amount of time than Year Sevens. My Plan As there are over 170 pupils in each year, I will only be using a sample of fifty pupils from each year. I will randomly select these fifty pupils, using a certain method. I will then group my fifty data values into a grouped frequency table. This is because fifty is still a large number of lengths to be dealing with when carrying out certain calculations. Using my random data values, first I will calculate the mean. The mean is a type of average, which represents the pupils' accuracy at estimation. As I believe that Year Eleven's estimations will be more accurate than the Year Seven's, I therefore predict Year Eleven's mean value to be close to 1.58m. Next I will calculate the standard deviation of the two data
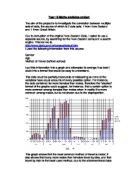
The aim of the project is to investigate the correlation between multiple sets of data, the source of which is 2 data sets, 1 from New Zealand and 1 From Great Britain.
Year 10 Maths statistics project The aim of the project is to investigate the correlation between multiple sets of data, the source of which is 2 data sets, 1 from New Zealand and 1 From Great Britain. Due to corruption of the original New Zealand Data, I opted to use a separate source, by searching for the New Zealand census in a search engine. This led me to http://www.stats.govt.nz/census/default.htm I used the following information from this source: Gender Age Method of Travel (to/from school) I put this information into a graph and attempted to arrange it as best I could into a format that would be easy to understand. This data could be partially inaccurate or misleading as none of the variables have equal amounts of every possible option. For instance, the data contained far more females than males, therefore the "stacked" format of the graphs could suggest, for instance, that a certain option is more common among females than males when in reality it is more common among males, but is not shown due to the disproportion. This graph shows that the most common method of travel is motor; it also shows that many more males than females travel by bike, and that travel by train is the least used method; due to the aforementioned bias in the data, it is relatively difficult to ascertain any conclusive information relating to ages. Despite this, the graph suggests

Maths Data handling Corsework
Maths Data Handling Coursework The aim for this piece of coursework is to make 3 hypotheses as a core plan for my investigations, then process, analyse and interpret information from the data I have been provided with from the school shared area. I will do this by using my data handling skills and using computer software such as Microsoft Excel to help me. The data I have been provided with contains information about the fitness of Year 7, 8, 9 and 10 pupils. This data consists of information such as bleep test performances in autumn and spring, cross country-Pe house run positions, and whether pupils are involved in rugby or rowing teams. There is also additional information showing what grade pupils are on at their musical instruments as well as a year 10 sports GCSE class data that shows information about pupils and their abilities in many exercises, mostly in circuit training. Class Pupil Number Pe bleep test autumn Pe bleep test spring Pe house run position Musical Instrument Level School Team 9.0 Abs 67 Rugby 2 8.3 0.1 59 Rowing 3 9.6 9.0 65 4 9.7 9.6 DNR 2 Rugby 5 0.0 inj 66 Rugby 6 8.4 0.2 79 3 7 9.6 0.2 34 Rugby 8 7.4 7.5 85 9 9.2 0.2 DNR 0 inj 3.6 3 Rugby 1 5.4 7.5 00 2 inj 9.0 55 Rugby This is an example of the data I have used. It is from the Yr 10 data spreadsheet and shows what class a pupil is

MATHS COURSEWORK - Mayfield High - To analyse data provided by Mayfield High School by using a range of different techniques...
Objective To analyse data provided by Mayfield High School by using a range of different techniques. Hypotheses . I am going to investigate the relationship between the more hours of TV watched and the students IQ in year 10. 2. I am going to investigate that students in year 11 will have a greater spread of weight (BMI) than students in year 10. 3. I am going to investigate the relationship between the gender and the IQ for students at Key Stage 4. For this data handling coursework I have been provided with data to assist me with proving my hypotheses. The data that I will be using to investigate my hypotheses is secondary data provided by a school called Mayfield High School. The data provided consists of data for key stages. It contains 13 categories of data ranging from Year Group to distance walked to school. Hypothesis 1 The reason I chose this hypothesises because it will provide me accurate information on whether or not watching television actually does cause the IQ to decrease. The obvious theory behind this is that the more hours spent watching TV the lower the IQ as it is thought that TV will prevent students learning meaning they will have a lower IQ. Hypothesis 2 The notion behind my second hypothesis is that it will be able to prove whether or not students in year 11 are more conscience about their weight than students in year10. I predict

Handling data. I am trying to find out whether it is easier for children in England to get to school than children in South Africa. In other words, I am determining accessibility for both regions.
GCSE Maths Coursework- HANDLING DATA- July 2004 Introduction In this investigation I will examine how children in different parts of the world travel to school and how easily accessible their schools are. Accessibility will be determined by time taken to travel to school and distance covered. In order to establish a link between time taken and distance covered and how it relates to accessibility, there are a number of factors I need to take into consideration. These are examined more closely in my hypothesis. The two parts of the world I have chosen to examine are England and South Africa. I will make a prediction comparing these two countries after setting out my hypothesis. Hypothesis I am trying to find out whether it is easier for children in England to get to school than children in South Africa. In other words, I am determining accessibility for both regions. To do this clearly and precisely, I have decided on three initial methods in order to obtain my evidence. . Time Taken 2. Distance Travelled 3. Method Used I am to find out if children in England take less time to get to school by travelling a shorter distance, over a shorter length of time using various forms of modern transport which are currently not as readily available in many parts of South Africa. This is because England is on the whole more developed and westernized than South Africa. I have used 3

The investigative task. Do housewives or working adults have a faster working pulse rate?
The Investigative Task Investigate: Do housewives or working adults have a faster working pulse rate? I am going to investigate this area of my investigative task topic, because I have always wondered this question, because when ever I want something after I come back from school they are always telling me they are tired so which one of them is more tired my mum the housewife or my father who is the working adult. Now there are many ways that you can investigate and find answers to this question like taking there pulse rates, or timing how long it takes them to do something and the one with the longest time would be the one most tired, but I have used the method of taking results of their pulse rate. I am using his method because it is the most easy and eligible one for me to carry out as a task. I plan to find out the answer of this question, by taking results of many of my results, but halving the amount up so I would get possibly 8 relatives that work and 8 relatives that are housewives. I will record the results, then go further looking for pattern and finding the average pulse rate for each category, furthermore to make this topic more interesting and to spot patterns more easily I will put my results into a graph and then investigate further from that. My hypothesis is that working adults would have a higher pulse rate because; working adults get up earlier

GCSE STATISTICS/Data Handling Coursework 2008
GCSE: Data Handling Coursework Introduction For this data handling project, I shall use data from athletics; track and field events and also the mass and height of the pupils from years 7 to 11, from the Athletics data spreadsheet. The subjects are only boys, from one school. There is a large amount of data in the sample, including times for 100m, 200m, 400m, 800m and 1500m, and also events such as long jump, triple jump, shot, javelin and discus. There is also a bleep test result and height and mass of students too. The data should be reliable, however I shall check for any anomalous records, then discard any from my sample. I shall make three hypotheses based upon this data. I shall then show how I will test these hypotheses in my plan to prove or disprove them. Hypotheses The bleep test is an indication of aerobic respiration, event within the data; it is a test of endurance and also fitness. I think that fitness and health are related and the BMI, body mass index, of a person can be a good representation of health, despite sometimes not taking into account people with high muscle: fat ratios. I therefore think that people with a BMI in the "healthy" 20-24 bracket will have a better score for the bleep test than those outside of it. As children grow, they grow stronger and fitter, the shot putt is a good test of strength. Therefore I think that people have a further

Data Handeling
Maths Coursework In this piece of coursework I am going to explore the statement "the older a car is the cheaper it will be". To do this I am going to be inspecting two hypotheses: "the older a car the more miles it would have done" and "the more miles a car has done the cheaper it will be" To do this I have gathered the needed information on 40 cars, this would be the price when new, the price when used, the mileage and the age. The information was got from a used car sales place and to narrow the amount of cars information I have I will pick randomly from the list of around 200, I will randomly choose the information using the random number key on my calculator, I will the pick out the car number accordingly. Bellow is the information I will be working from: Car No. Make Model Price new (£) Age (years) Price old (£) Miles Travelled Citroen Saxo 7980 9 180 7980 3 Peugeot 206 9257 7 2780 20000 5 Ford Probe 20570 0 055 0000 2 Fiat Bravo 1970 7 885 51000 3 Renault Laguna 5580 4 6630 40000 4 BMW 525i SE 28395 0 3480 55000 6 Ford Ka 9725 8 2090 0000 20 Ford Fiesta 95-99 7695 0 755 0000 23 Honda Prelude 7320 0 810 6000 27 Citroen AX 7230 0 080 2000 31 Skoda Fabia 7950 5 3585 20000 37 Renault Clio 8800 7 2210 8000 48 Peugeot 06 9560 0 270 41000 55 Mazda MX-3 7170 0
Mayfield High School
Mayfield High School Introduction I have decided to investigate the truth behind the theory that "Blonde haired, blue eyed people are better than others" brought out by Adolf Hitler. I will be trying to see if blonde haired, blue eyed I've decided to investigate "Are blonde-haired, blue-eyed people are generally better than people with other types of hair and eye colour. The concept of "aryanization" is a Nazi concept based on Hitler's ideology that the Aryan race is a master race, cleverer, more beautiful (in terms of females) and more muscular (in terms of males) than other races. I have decided to carry out an investigation to see if this true by looking at secondary school pupils. Mayfield High school is fictitious secondary school with records based on a real school. Using the student database, I will try to see if aryanization theory of the Nazis had any basis at all. Planning Mayfield High school has 1,183 students, of which 179 are blonde haired and blue eyed. There are 124 of these students in Key stage 3 and 55 students in Key Stage 4. I will be starting off with the students in Key Stage 3. This means I will be doing my research on students in Year 7 to Year 9. Secondly, I will research into the students of Key Stage 4, the students in Year 10 and Year 11. To do a proper investigation, I will have to take samples from each class. I will use the stratified
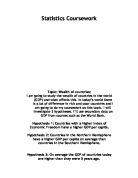
Statistics Coursework. I am going to study the wealth of countries in the world (GDP) and what affects this. Hypothesis 1: Countries with a higher Index of Economic Freedom have a higher GDP per capita.
Statistics Coursework Topic: Wealth of countries: I am going to study the wealth of countries in the world (GDP) and what affects this. In today's world there is a lot of difference in rich and poor countries and I am going to do my coursework on this topic. I will investigate 3 hypotheses. I'll use secondary data on GDP from sources such as the World Bank. Hypothesis 1: Countries with a higher Index of Economic Freedom have a higher GDP per capita. Hypothesis 2: Countries in the Northern Hemisphere have a higher GDP per capita on average than countries in the Southern Hemisphere. Hypothesis 3: On average the GDP of countries today are higher than they were 5 years ago. Hypothesis 1: Countries with a higher economic freedom have a higher GDP per Capita A higher economic freedom will probably mean there is higher standard of living in that country, because countries with a free market economy would be able to make more money. There is an "Index of Economic Freedom", a measure of economic freedom of different countries that was created by the Wall Street Journal. I will use the most recent data from 2008. GDP per Capita can measure how wealthy the people of a country are on average: It is the money that a country makes divided by the population. I will use the data from the World Bank and the International Monetary Fund, because their data is reliable. First I will