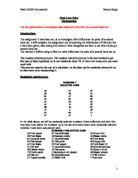
From this table I am going to put the information into a tally chart so that I can change the information into charts and graphs, the tally chart below shows how many of a make of car there is in the data sheet.
As you see in this table there are a few cars that only appear once so I am going to list them as other when I put the into charts and graphs.
In the two graphs above I have found that Rover is the Modal make of car I was surprised at this as I thought that is was going to be ford as I said in my prediction, when looking thought the information I found that 6 out of rovers 7 cars are all under £3000 to buy at second hand price maybe this is why it is the Modal make.
Next I am going to investigate what is the Modal color of car, I will do this the same way that I done the Modal make.
From the charts above I have found that there is a tie between red and blue, I don’t really think that the color of the car would affect the price. I think that maybe it would be a good or bad point for the customer but not for the price.
I was right in saying that red would be the Modal color in my prediction.
Conclusion:
I have found that rover is the modal make of car and that most of its second hand prices are lower than £3000 so I think that this is why it is the modal make, I also found that red and blue are the modal color of car but I don’t think that color would really affect the price as I said above. I am now going to further my investigation using scatter graphs and the data to find out what it really is that affects the price of a second hand car.
I am now going to find out what are the mean new prices of the 36 cars that were selected.
To do this I am going to add up all the new prices and divide that by how many there is.
I found that when doing this process the answer that I found was 12682, so this means that the mean new price was 12682, which means that most of the new prices in the list are around 12682.
On the next page (labeled graph 4) I have produced a scatter graph which shows the correlation between 2nd hand price and new price, the graph has a positive correlation although the points don’t go in a complete strait line but they still go along the line of best fit, the graph shows that the 2nd hand price does get lower as the new prices gets higher. Now I am going to find the mean 2nd hand car prices by doing the same process as before, I found that the mean 2nd hand price was 3995 which means that most of the 2nd hand prices are around 3995, this information is also shown in graph 4.
What effects the price of a second hand car?
I am going to investigate this question using what I think are the most important factors from the data sheet, they are Age, Number of Owners and mileage.
First I am going to investigate age to see if it affects the prices of the cars.
The investigation is shown in a scatter graph on the next page (Labeled graph 1) this graph shows that as the car gets older the price goes down.
Next I am going to do a scatter graph for the number of owners to see if that affects the price of a second hand car.
As I said in my introduction that I predict that the number of owners would affect the price of a second hand car I wasn’t right the graph shows no correlation between the two so no the number of owners does not affect the price of a second hand car.(This graph is labeled graph 2)
And finally I am going to see if mileage affects the price of a second hand car.
I am very surprised at the result of this investigation I found out that there is no correlation between mileage and second hand price on my graph, I thought there would have been a strong correlation between the two but there was only a week negative correlation as the point were not spread close to the line of best fit. (This is shown in graph 3)
Out of investigating to see if age, number of owners and mileage affect the price of a second hand car I found the only age in my investigation affected the price of the second hand cars.
I found that as the car gets older the price gets lower EG the Volkswagen golf was £15080 and after 15 years the price bombed down to £400, if age didn’t affect the price of this car then in would of just went down a little bit.