Year 10 Girls
Year 11 Girls
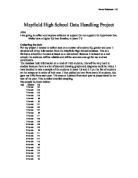
Here is my sample of 30 boys and 30 girls
Boys Girls
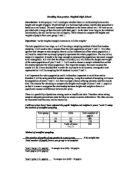
For a more useful representation of the data that I have collected I have drawn up a Frequency table for all the data, gender, IQ, and KSY 3 Math’s results.
Boys
Girls
Math’s Key Stage 3 Results
I am now ready to begin comparing, and analyzing the data I have recorded by using diagrams.
Firstly I am going to begin by analyzing the data about Math’s KS3. Using bar charts I am going to compare the Frequency results for Boys and Girls.
Mean KYS 3 Math’s Results
Mean KYS 3 Math’s Results for Boys = 116 - 30 = 3.86
Mean KYS 3 Math’s Results for Girls = 113 - 30 = 3.76
Modal KYS 3 Math’s Results
Modal KYS 3 Math’s Results for Boys = 3
Modal KYS 3 Math’s Results for Girls = 4
Median KYS 3 Math’s Results
Median KYS 3 Math’s Results for Boys = 4
Median KYS 3 Math’s Results for Girls = 4
Range of KYS 3 Math’s Results
Range of KYS 3 Math’s Results for Boys = 3
Range of KYS 3 Math’s Results for Girls = 3
Results: All the measures (Mean, Mode, and Median), apart from Mode, are greater for the boys than the girls. The range for the KS 3 Math’s Results is exactly the same.
In conclusion the Boys, in general, tend to have higher results than the girls (11 out of 30 or 34% have 5 or higher, against only 4 out of 30 or 7.5%), while the girls tend to be more consistent with most of their results being 4’s whilst the boys results are more spread out (11 3’s, 15 4’s, 4 5’s against 11 3’s, 8 4’s, 10 5’s, 1 6).
IQ’s
I will now analyze the IQ data in exactly the same way, apart I will be using Histograms because IQ’s are continuous.
Histogram of Boys IQ’s
Histogram of Girls IQ’s
I am also going to compare the data using a frequency polygon for both genders.
Averages
For the IQ’s, because, they are continuous I need to find the modal class interval, instead of the mode. Because it will show us the class interval with the most valued.
Also because the median can’t be organized into class intervals I am going to round it to the nearest 5, I will also do this when calculating the mean.
All three measures of average in the sample were basically equal, with the exception of range which was higher for the boys, who had a range of 44 IQ points while the girls only had a range of 32, showing that the boys IQ’s are wider spread than the girls.
The sample also shows that while the boys IQ’s are spread out the majority, in this case 23%, is in the class interval between 111-120.
While the girls majority, 43%, occurs in the class interval between 91-100. The data also shows that there are more boys with an IQ of 90 or under than there are girls, however there are also more boys with an IQ of 120 or over than there are girls.
Expanding my Investigation
I am now going to try to prove or disprove my second hypothesis; IQ affects Key Stage 3 Math’s results, by comparing the data that I have accumulated concerning both IQ and Key Stage 3 Math’s Results.
The first thing I will need to do will be to bring up the my first sample table, with both IQ and Key Stage 3 data on, for the 60 sample pupils.
Boys Girls
The most sensible way to compare this data is with a scatter graph, as it displays both pieces of data for the pupil.
Conclusion for Second Hypothesis:
We can see that there is a positive correlation between IQ and the pupils Key Stage 3 Math’s results. Suggesting that the result a student obtains in Key Stage 3 Math’s does depend on his IQ.
So basically we have proven that my second Hypothesis is right, with very little exceptions, only one main one a pupil with an IQ of over 120 got a result 3. As the scatter graph showed the majority of the pupils followed my hypothesis with the high results being obtained by the pupils with the higher IQ’s.
So now that my hypothesis is correct I believe I can make the prediction, using the line of best fit, that for a pupil to obtain a 2 as their result they would have to have an IQ of 69.
Furthering my Investigation
In the earlier parts of my investigation I found evidence to suggest that IQ, and thus Key Stage 3 Math’s Results, are affected by gender. So, naturally, the step is to extend my line of enquiry to investigate how the correlation between IQ and Key Stage 3 Math’s Results is affected by gender. Thus I am going to test my new hypothesis that:
There will be a better (positive) correlation between IQ and Key Stage 3 Math’s Results if we consider boys and girls separately.
We already have our stratified sample of 30 boys and 30 girls, from years 10-11, so we can immediately test our hypothesis.
We will start by dividing the scatter diagram from earlier in the investigation into 2, one for boys and one for girls.
Scatter Diagram for Boys
Scatter Diagram for Girls
Dual Scatter Diagram
Conclusion
We now have evidence to support our third Hypothesis:
There will be a better (positive) correlation between IQ and Key Stage 3 Math’s Results if we consider boys and girls separately.
We have seen that there is in fact a better correlation between the results when the genders are compared speratley, with less points been off the line of best fit. There are however still exceptions, and we need to remember that that the line of best fit is only a best estimation of a relationship, in this case IQ and Key Stage 3 Math’s Results, and some values do fall outside the general trend set by the line of best fit.
Considering Age:
I could also consider age in my investigation into the relationship between IQ and Key Stage 3 Math’s results, but both pieces of data are Age impaired (if u will). IQ is a constant throughout your life and the Key Stage 3 Exams are only taken at Year 9, so my investigation wouldn’t benefit any from the consideration of age into the relationship between them.
Final Summary of Results
From our stratified sample of 30 boys and 30 girls, taken from years 10-11, we see these key points immerge:
In the investigation into Key Stage 3 Math’s Results all the measures (Mean, Mode, and Median), apart from Mode, are greater for the boys than the girls. The range for the KS 3 Math’s Results is exactly the same. The Boys, in general, tend to have higher results than the girls (11 out of 30 or 34% have 5 or higher, against only 4 out of 30 or 7.5%), while the girls tend to be more consistent with most of their results being 4’s whilst the boys results are more spread out (11 3’s, 15 4’s, 4 5’s against 11 3’s, 8 4’s, 10 5’s, 1 6).
In the investigation into IQ all three measures of average in the sample were basically equal, with the exception of range which was higher for the boys, who had a range of 44 IQ points while the girls only had a range of 32, showing that the boys IQ’s are wider spread than the girls. The sample also shows that while the boys IQ’s are spread out the majority, in this case 23%, is in the class interval between 111-120. While the girls majority, 43%, occurs in the class interval between 91-100. The data also shows that there are more boys with an IQ of 90 or under than there are girls, however there are also more boys with an IQ of 120 or over than there are girls.
We can see that there is a positive correlation between IQ and the pupils Key Stage 3 Math’s results. Suggesting that the result a student obtains in Key Stage 3 Math’s does depend on his IQ.
So basically we have proven that my second Hypothesis is right, with very little exceptions, only one main one a pupil with an IQ of over 120 got a result 3. As the scatter graph showed the majority of the pupils followed my hypothesis with the high results being obtained by the pupils with the higher IQ’s. I believe I can make the prediction, using the line of best fit, that for a pupil to obtain a 2 as their result they would have to have an IQ of 69.
We have seen that there is in fact a better correlation between the results when the two gender are compared speratley, with less points been off the line of best fit. There are however still exceptions, and we need to remember that that the line of best fit is only a best estimation of a relationship, in this case IQ and Key Stage 3 Math’s Results, and some values do fall outside the general trend set by the line of best fit.