
Fluid flow in a duct of varying cross-section.
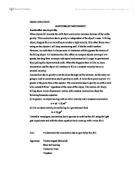
Fluid flow in a duct of varying cross-section Introduction The objective of the experiment was to highlight the relationship between pressure, fluid velocity and static head in a pipe of varying cross section. The arrangement that was used is called a Venturi, this is because the pipe (which had constant diameter) narrowed with a short contraction to a narrow throat and was followed by a long diffuser back to the pipes original diameter. Results See figures 1, 2 and 3. Discussion During the experiment as the water travelled through the narrower neck of the pipe the pressure was reduced. This was because as the water travelled through the neck the velocity of the water increased as the cross sectional area decreased. The increase in velocity increased the force with which the water travelled through the pipe. The increase in force was grater than the reduction in cross sectional area, which was why a pressure drop occurred. The greatest change in static head occurred between tap 3 and 4 (as can be seen in figure 1). The static head was increased significantly for all three flow rates due to the drop in pressure. The results obtained from experiment (which can be seen in figure 2) are actually very different to the results obtained from theory. The results obtained from theory are for the ideal static head which was very small whilst with the experiment the variations
Acceleration due to gravity.
OGIDI JONATHAN. MATTERS OF MOVEMENT Acceleration due to gravity. When objects fall towards the earth their acceleration increases because of the earths gravity. This acceleration due to gravity is independent of the object's mass. A falling object, dropped from an aircraft soon reaches a high velocity. If no other forces were acting on the objects it will keep accelerating until it hits the earth's surface. However, on earth there is always some air resistance which opposes the motion of the falling object. Air resistance has little effect on compact objects moving at low speeds, but drag force increases with speed and eventually it is equal to gravitational force pulling the object towards earth. When this happens there will be no more acceleration and the object will continue to fall at a constant velocity, know as terminal velocity. Acceleration due to gravity is not the same through out the universe. In this essay am going to look at acceleration due to gravity on earth. It varies from place to place: it's greater at the poles than at the equator. The acceleration due to gravity on earth is said to be around 9.81ms-1 regardless of the mass of the object. The motion of a freely falling object in one-dimensional motion with constant acceleration obeys the following kinematic equation (i) In general, an object moving with an initial velocity and a constant acceleration

Graphical Analysis of Motion
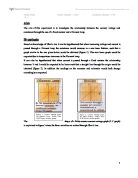
I. Introduction: Equations are great tools to describe a particular phenomenon or situation, but at times, they would not just suffice. We need visualization to further understand what is happening – a mathematical picture called a graph. More than just a visual representation of the relations between certain quantities plotted with reference to a set of axes, graphs give us a complete description of various actual events. A common example of graphs is graphs of motion. Motion graphs come in different forms, depending on which kinematic quantity is assigned to a particular axis. In dealing with motion graphs, a basic model for understanding is the slope - the graded change in the magnitude of some physical quantity or dimension: = That is, if you set time and distance for your x and y-axes respectively, you will be able to derive the velocity; or the acceleration for velocity and time. In this experiment, it is aimed to interpret the different motion graphs through its theoretical explanation and the actual act of doing the motion, done in the graph matching. Along with the graph interpretation is the mathematical computation of the gradients of the graphs: the velocity and the acceleration. This experiment was done through the aid of a motion detector, which detects objects at a range of 30o and with an interface that allows the user to see a graphical
The aim of this experiment is to investigate the relationship between the current, voltage and resistance through the use of a fixed resistor and a filament lamp.
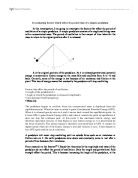
Aim The aim of this experiment is to investigate the relationship between the current, voltage and resistance through the use of a fixed resistor and a filament lamp. Hypothesis Based on knowledge of Ohm's law it can be hypothesised that when increasing voltage and current is passed through a filament lamp the resistance would increase in a non-linear fashion, such that a graph similar to the one given below would be obtained (figure 1). This non-linear graph would be expected due to temperature increases in the filament lamp. It can also be hypothesised that when current is passed through a fixed resistor the relationship between V and I would be expected to be linear such that a straight line through the origin would be obtained (figure 2). In addition the readings on the ammeter and voltmeter would both change accordingly as expected. The shape of a fixed resistor current-voltage graph (I-V graph) is explained in figure 3 since the three variables are related through Ohm's law. Circuit Diagrams Equipment Fixed resistor & Filament Lamp- to impede and obstruct current flowing through circuit Ammeter- to measure current flowing through the circuit Voltmeter- to measure the voltage present in the circuit and to make sure the power supply is correctly calibrated. Power Supply- to act as the adjustable power source for the circuit Wires- to connect the circuit
Investigating factors which affect the period time of a simple pendulum
Investigating factors which affect the period time of a simple pendulum In this investigation, I am going to investigate the factors that affect the period of oscillation of a simple pendulum. A simple pendulum consists of a single oscillating mass with a concentrated mass. The period of oscillation is the amount of time taken for the mass to return to its original position after it is released. A is the original position of the pendulum. As it is released gravitational potential energy is converted to kinetic energy as the mass falls and oscillates from A to -A and back. On earth, some of the energy is lost because of air resistance and friction at the pivot. This loss of energy means that eventually the pendulum will stop oscillating. Factors that affect the period of oscillation: • Length of the pendulum (L) • Angle at which the pendulum is released (Amplitude) • Gravitational Field Strength (g) • Mass (m) The pendulum begins to oscillate when the concentrated mass is displaced from the equilibrium point. When the mass is raised it gains Gravitational Potential Energy (GPE). When it is released gravity acts on it and it moves back toward the equilibrium point. As it loses GPE it gains Kinetic Energy (KE), and when it reaches the point of equilibrium it does not stop but continues past. At this point it has maximum kinetic energy and therefore maximum

Atomic structure.
AS CHEMISTRY MODULE 1 ATOMIC STRUCTURE Easy Stuff * Matter is made up of atoms * All atoms of one element are of the same kind. * A compound contains atoms of two or more elements combined in fixed proportions. * Atoms are very small * Atoms are composed of sub-atomic particles; protons, neutrons and electrons The History The electron The electron was the first particle to be discovered by J J Thomson, who was looking into passing an electric current through gases. At the positive end of the tube a glow was visible. This glow could be deflected by both electric and magnetic fields, suggesting that there were rays of negative particles travelling from the cathode to the anode. These particles are obviously electrons. Thomson went on to suggest that atoms were like plum puddings with negative electrons embedded in a sphere of positive charge like the currants in a plum pudding. This was disproved by the Geiger-Marsden experiment, which involved measuring the deflection of alpha particles that were directed at a thin gold foil. The pudding model suggests that these particles would pass through the foil almost undeflected. However Geiger and Marsden found that, although most of them did this, some bounced back. Picture This gave a new picture of the atom with a small positively charged nucleus containing almost all the mass, surrounded by empty space through which