Statistical Process Control.
Statistical Process Control A common complaint among production personnel is that engineers responsible for specifications do not understand production problems. Inspection personnel often complain not only about the poor quality of manufactured product but also about the unreasonableness of specified tolerances. In fact, very frequently inspection practices develop that substitute the inspector?s views regarding proper tolerances for those actually specified by engineers. In many organizations, there is evident need for basic on which designers, production personnel, and inspectors can understand each other's problems. The development of Quality Circles in Japan was an approach to solving this problem. In the past many arguments among these three groups have been carried on with more heat than light because of the absence of fact in a form that would provide a basic for agreement. In many case these facts can be provided by use of statistical quality control techniques. In fact, statistical quality control provides a common language that may be used by all three groups in arriving at a rational solution of mutual problems. Many of the techniques developed by mathematical statisticians for the analysis of data may be used in control of product quality. The expression "Statistical Process Control" may be used to cover all uses of statistical techniques for this purpose.

Collect data from a population with a view to estimating population parameters.
S1 Task D: Authorship You are required to collect data from a population with a view to estimating population parameters (e.g. µ and 2) by using the estimation techniques in this module. This should involve taking a random sample as well as calculating and comparing confidence intervals. Investigate whether it is possible to gain information about authorship of a text using statistical measures: e.g > Modern text v Historical text > Books by the same authors > Adult text v Child's text, etc. AIM My aim is to investigate how sizes of sentences differ in comparing an Adult text with a Child's text. The adult text I will be using is called 'Jurassic Park' and the Child's text I will be using is called 'A treasury of stories from Hans Christian Anderson.' It would usually be assumed that a child's text would have smaller sentences and smaller words - I will be investigating whether this is true or not by taking random samples from two texts and analysing my data. The two populations I will be using are books with the names mentioned above. Both of these books were randomly chosen from the bookshelf in my study room. HYPOTHESIS I hypothesise that the sentence sizes will be larger in the child's text compared to the adult text because of the fact that there seems to be more dialogue in the adult text, indicating shorter sentences. THEORIES USED The most important

Do Left and right-handed people have roughly the same reaction time with their dominant hand.
Hypothesis 1 I predict that left and right-handed people will have roughly the same reaction time with their dominant hand. Plan In order to prove my hypothesis I am going to use stratified random sampling, so that I get a fair sample to conduct my study. I will find both the average and the range to see if my hypothesis is correct. Stratified Random Sampling I am going to use 30 pieces of data for my sample. I sorted the data excluding any that did not say what hand they used or used both hands as their dominant. Firstly I must find the ratio of left handed people to right: There are 300 pieces of data in total. There are 32 left handed people. And 268 right handed people. In order to find the ratio I have to divide the number of left handed people with the total number of people, and then I have to multiply the answer by 30. I have to do the same to the right. Left= 32 / 300 x 30 = 3.2 Right=268 / 300 x 30 = 26.8 The ratio is 3.2 : 26.8 (left : right) Because we are dealing with people we can use decimals so we have to round the decimals. The ratio comes to 3:27 This means we have to choose 3 left handed people and 27 right handed people (the ratio should add up to 30). Because we are using stratified random sampling we cannot just pick the data ourselves, we have to use a calculator. You type in Ran# (number of sample, which in this case is 30). In order

Investigate the distribution of males´ and/ or females in families. You may choose, for example, to collect data on the distribution of girls in families of three children and to estimate the probability of a female birth.
Normal Distribution Living with uncertainty For this coursework I have chosen to do assignment B2 It states: Investigate the distribution of males´ and/ or females in families. You may choose, for example, to collect data on the distribution of girls in families of three children and to estimate the probability of a female birth. To be able to collect the necessary data for the investigation, I will have to look at families with 3 children. The datum will be collected from pupils in the school I go to. I will collect the data by sending questionnaires to every pupil in the school from year seven (aged 11-12) to year thirteen (aged 17-18) asking them how many children are in there families and how many are male/female. From here the data will be sorted through and only the relevant questionnaires (the ones with three children in their families) will be taken out. A sample size of thirty is thought to be sufficient in this data collection so to collect this number every successful questionnaire was given a number (136 in total). 136 was placed into a graphic calculator which then randomly gave out 30 numbers. It should be noted that the larger the sample size the more reliable the results are likely to be. Hypothesis: The probability of having a boy in a three-child family is above 75 %. The probability of giving birth to a boy is the same as a girl, this can be proved

The aim of this investigation was to explore and analyse an aspect of human variation.
Aim The aim of this investigation was to explore and analyse an aspect of human variation. Hypothesis There will be a positive correlation between an individual's foot length and their hand span. This may be due to linkage; the genes that create these characteristics may be positioned on the same chromosome so that they become linked, and are inherited together. This linkage causes the two characteristics to become associated so that a person with large feet will also have large hands. Variables In order to create a fair investigation, it was necessary to consider the variables that affect an individual's foot length or hand span. Any variables that were likely to disrupt the results were controlled and those measured were recorded accurately so that any correlation could be observed and evaluated successfully. i) Age - The majority of individuals stop growing by the age of eighteen. Below this age, people grow at different rates and for this reason, cannot be compared accurately. In this investigation, the sample included only, people above the age of seventeen. Above this age, most people will have attained their maximum growth and therefore their maximum foot length and hand span. ii) Gender - The average male is ten centimetres taller than the average female. It follows that this difference will also be translated in an overall trend that males will have greater

To investigate any relationship between height and foot size in adolescents, aged 7 to 16 years.
Maths Statistics Coursework Sarah Fergusson Introduction I was initially given a secondary set of data, with results of a number of questions, which were answered by 1600 students. 721 were in KS2, 642 in KS3 and 237 in KS4. The first problem I was faced with was to decide which pieces of data I would use, as there were 25 questions asked. I need to use data which is continuous, to get the best use of my results. For example, if I were to use car colour and shoe size, I would not be able to do very much with the information I had. Car colour can only be red, blue, white, etc, and show size can only be size 1-12, etc. However, with time and height, the data is continuous, as a person can be 125.5 cm tall, not just 125 or 126, for example. After considering this, I have decided to investigate foot size and height. Aim To investigate any relationship between height and foot size in adolescents, aged 7 to 16 years. Hypothesis The taller a person is, the longer their feet are. Plan Before starting my investigation, there are a few points I need to simplify. For example, is my measurements were different, would this be suitable to investigate? I need to ensure that both variables are measured in centimetres, so I can fairly compare them. If I am going to talk about taller or shorter, I need to state what is "tall" and what is "short". The heights I am using range from

Statistical investigation into pupils at Mayfield high school
STASTICAL INVESTIGATION INTO PUPILS AT MAYFIELD HIGH SCHOOL AIM In this investigation I have set out to explore two hypotheses regarding secondary data supplied to me concerning pupils at Mayfield High School in years 7 to 11. The secondary data supplied included data on a range of issues including each pupil's weight, their IQ and the average number of hours each pupil watched TV per week. My hypotheses below explore specifically these elements from the secondary data supplied to me. Hypotheses 1 - Correlation between time spent watching TV and weight My hypothesis is that there will be a connection between the average number of hours spent watching television and the weight of each pupil. My prediction is that there will be a positive correlation: i.e. that the heavier pupils will be those who spend more hours watching TV. The reason for my prediction is that I believe that more time spent in front of the television means that there is less time for activity and, therefore, TV watchers are more likely to put on weight. I also think that TV watchers are more likely to eat snacks and junk food while watching TV, which would also result in weight gain. In my conclusion below, I consider outside factors which I have not taken into account in the investigation of this hypothesis which may influence my results. Such factors are: height, gender, age, method of travel.
Investigating the Relationship Between the Amount of Money a Football Club Receives and its Success.
WILLIAM WEBSTER 5SK MATHS STATISTICS COURSEWORK Investigating the Relationship Between the Amount of Money a Football Club Receives and its Success In this investigation, I will look at a set of statistics for English football clubs for the 1998 - 1999 season. Using these, I will look at how the amount of money a football club receives affects its success. Measuring 'success' It is difficult to measure success, as there is no numerical way to quantify it. In my investigation, I will look at success in terms of achievements on the pitch as opposed to the success of the club as a business. I will measure success by looking at the relationship between money and three factors. These are: * League Position - This is a measure of the club's 'success' as the better the team performs, the higher the league position. * Goal Difference - This is calculated by total goals scored minus total goals conceded. This is a measure of the team's success as the better the team performs, the greater the goals scored and the less the goals conceded, thus the greater the goal difference. * Stadium Capacity - This can be considered as measure of success. It can be argued that the more successful a team is, the better supported it will be and thus the greater the stadium capacity in order to accommodate more fans. It is important to note that this factor is not as significant a measure of
Year 10 students generally over estimate obtuse angles but under estimate acute angles
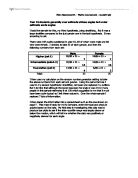
Year 10 students generally over estimate obtuse angles but under estimate acute angles I took the sample for this, my third hypothesis, using stratifying. But it was a large stratifies compared to the just gender one in the last hypothesis. It was according to set. There were 187 pupils questioned in year 10, 92 of whom were male and 86 who were female. I decided to take 25 of each gender, and then the following numbers from each set: Male Female Higher (set 1) 28/92 x 25 = 7 24/86 x 25 = 7 Intermediate (sets2-3) 50/92 x 25 = 4 54/86 x 25 = 6 Foundation (set 5) 4/92 x 25 = 4 8/86 x 25 = 2 Total: 25 25 I then used my calculator on the random number generator setting to take the above numbers from each set and gender. Using the same formula I used in my second hypothesis I identified, removed and replaced my outliers. But I did find that although the lower boundary for angle 2 was 141.5 many people in this sample estimated it at 120 which suggested to me that it must have been quite typical so I left these values in. Over the whole sample I replaced 7 lots of information. I then placed the information into a spreadsheet such as the one shown on page ?. This made it easy for me to compare, enter formulas and produce graphs based on the data. My first step in investigating this data was to produce box plots to see if the inter-quartile

Statisctics coursework
For my data presentation coursework, I will attempt to prove my hypothesis. My hypothesis is that European countries are wealthier than African countries. First of all, I will find the range of both sets of data. Europe Africa -55100 -12400 2300 500 Range= 52800 11900 Next I will find the mean for each set of data. Europe GDP Tally Freq. Mid Total 0-4999 IIII 4 x 2500 = 10000 5000-9999 IIIIl II 7 x 7500 = 52500 0000-14999 IIIII II 7 x 12500 = 8400 5000-19999 IIIII II 7 x 17500 = 122500 20000-24999 IIIII I 6 x 22500 = 135000 25000-29999 IIIII IIIII I 11 x 27500 = 302500 30000-34999 IIIII