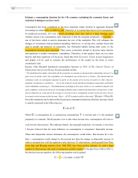
This essay neither examines a mathematical equation, nor does it analyze a distinguished mathematician. This essay explores a few philosophical aspects of math. Particularly, this essay covers the confound subjects covered by Zeno of Elea.
Mathematical Paradox Has Anyone Figured This Out Yet? Table of Contents: Introduction Page Background: Page Problems and Solutions: Page Implications and Uses: Page Conclusion: Page Abstract: This essay neither examines a mathematical equation, nor does it analyze a distinguished mathematician. This essay explores a few philosophical aspects of math. Particularly, this essay covers the confound subjects covered by Zeno of Elea. The math world has been disturbed, agitated, and even titillated by the mysteries of Zeno of Elea's paradoxes in questioning the laws of math and science. A Paradox, defined by Webster's dictionary, is "A statement that seems contrary to common sense and yet is perhaps true." In taking his arguments at face value, they may seem very logical. But they have each been repeatedly refuted, then stereotyped as nonsense or a mathematical incredulity by many a renowned mathematician. Zeno was a philosopher and logician, not a mathematician. He was the inventor of Dialectic and his greatest fame was for his Paradoxes. Zeno's Paradoxes have several complex philosophical aspects. But just as they have a philosophical and scientific approach, Zeno's paradoxes each have a profound mathematical twist. This essay will explain and analyze Zeno's paradoxes, as well as show arguments against them, as well as try and

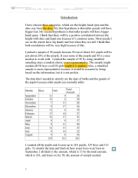
My Hypothesis is that 'Boys in Year 10 are better at estimating lengths of straight lines than Boys in Year 7'
G.C.S.E Maths Coursework - Handling data My Hypothesis is that 'Boys in Year 10 are better at estimating lengths of straight lines than Boys in Year 7'. The factors that influence the accuracy of estimation are children in Year 10 are more mature than children in Year 7. On average Children in Year 10 are more intelligent than children in Year 7. This probably would be because Year 10 students have studied subjects into further depth than children in Year 7. METHOD To verify this I will do a sample of the boys in our school. To do this I will find the total number of children in our school and sort it out according to Y10's and Year 7's. I will find out this information by going to the school office and finding out the figures. Out of this population, I will do a stratified sampling of 60 children. To do a stratified sampling of 60 children in the whole school, I will find the proportion of boys in Year 10 and Year 7. STRATIFIED SAMPLING In a stratified sample, the population is first divided into categories and the number of members in each category is determined. The sample is then made up of these categories in the same proportions as they are in the population. Random sampling chooses the required numbers in each category. In a random sample, every member of the population has an equal chance of being chosen. To obtain a sample of 60 students stratified

Investigating the different relationships between the T-total and T-number of the T-shape by translating it to other positions on the grid.
Investigating the different relationships between the T-total and T-number of the T-shape by translating it to other positions on the
I intend to see if these theories can been seen to affect sphere of influence of real settlements in Essex and the Lake District. The theories I am going to test are on range, accessibility, size of settlement, and tourism function.
I intend to see if these theories can been seen to affect sphere of influence of real settlements in Essex and the Lake District. The theories I am going to test are on range, accessibility, size of settlement, and tourism

The normal distribution
The normal distribution When many measures are taken of something (eg, scores in a test, people's heights, pollution levels in rivers) the spread of the values will have a bell shape, called the normal distribution. A number of statistical tests use this characteristic distribution (or dispersion) of values to test whether two samples are the same or different. There are several basic terms that are commonly used with the normal distribution. Average (mean) A measure of the average score in a set of data. The mean is found by adding up all the scores and then dividing by the number of scores. Range The difference between the largest core and the and smallest score. Median If a set of scores are arranged from lowest to highest the median is the score in the middle, with half above and half below. Mode The value that occurs most often Standard deviation s A measure of the standard (average) deviation of the scores from the mean.The larger the standard deviation the larger the range of values/variation in the data . Subtract each score from the mean 2. Times each difference by itself (negs turn positive) 3. Add up all the squared differences 4. Divide the total by the number of scores minus 1 5. Take the square root Standard deviation The normal distribution at right shows the percentage of scores/observations that lie within one, two or three standard
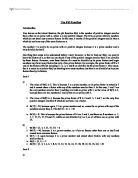
Investigation of the Phi Function
The Phi Function Introduction Also known as the totient function, the phi function ?(n) is the number of positive integers smaller than n that are co-prime with n, where n is any positive integer. The term co-prime refers to numbers which do not share any common factors. In this case, it means all the positive integers smaller than n which do not have any of the same factors as n. The number 1 is said to be co-prime with all positive integers because it is a prime number and is only divisible by itself. One thing that needs to be understood before I start, however, is that to find out ?(n), we need to know the factors of n, so that we can check if any of the positive integers smaller than it are divisible by those factors. However, even these factors of n must be divisible by its prime factors and larger numbers may have many factors but only a few prime factors. For example, the prime factor of 8 is 2 and all the factors of 8 (not including 1) i.e. 2, 4, and 8 are divisible by the prime factor 2. This means that it is easier to calculate ?(n) by checking how many numbers less than n are divisible by its prime factors than by its factors. Part 1 a) i The value of ?(3) is 2. This is because 3 is a prime number, so its prime factor is naturally 3 and it cannot share a factor with any of the numbers smaller than it. In this case, 1 and 2 are the only numbers smaller than

Understanding Motion I – Distance and Time
Experiment P01: Understanding Motion I - Distance and Time (Motion Sensor) Concept: linear motion Time: 30 m SW Interface: 500 & 700 Macintosh(r) file: P01 Understanding Motion 1 Windows(r) file: P01_MOT1.SWS EQUIPMENT NEEDED • Science Workshop(tm) Interface • base and support rod • motion sensor PURPOSE The purpose of this activity is to introduce the relationships between the motion of an object - YOU - and a Graph of position and time for the moving object. NOTE: This activity is easier to do if you have a partner to run the computer while you move. THEORY When describing the motion of an object, knowing where it is relative to a reference point, how fast and in what direction it is moving, and how it is accelerating (changing its rate of motion) is essential. A sonar ranging device such as the Motion Sensor uses pulses of ultrasound that reflect from an object to determine the position of the object. As the object moves, the change in its position is measured many times each second. The change in position from moment to moment is expressed as a velocity (meters per second). The change in velocity from moment to moment is expressed as an acceleration (meters per second per second). The position of an object at a particular time can be plotted on a graph. You can also graph the velocity and acceleration of the object versus time. A graph is a
Triminoes Investigation
Triminoes Investigation Sequences There are different lots of sequences such as Arithmetic progressions, Geometric progressions and other sequences. There are many types of sequences, sequences that increase by a fixed amount between each term are known as arithmetic progressions or arithmetic series. Odd and even numbers both increase by two from one term to the next. The multiples of seven increases by seven, from one term to the next. Arithmetic progressions There are many types of sequences, sequences that increase by a fixed amount between each term are known as arithmetic progressions or arithmetic series. Odd and even numbers both increase by two from one term to the next. The multiples of seven increases by seven from one term to the next. Odd numbers 1, 3, 5, 7, 9, ... Even numbers 2, 4, 6, 8, 10, ... Multiples of seven 7, 14, 21, 28, ... are examples of arithmetic progressions or arithmetic series. Geometric progressions Geometric progressions or geometric series are sequences in which successive terms are in the same ratio. To get the next power of two you simply double the previous value. In the example of exponential growth the next term is obtained by multiplying the previous term by 1.5. Powers of two 1, 2, 4, 8, 16, ... Exponential growth 10, 15, 22.5, 33.75, ... Exponential decay 20, 16, 12.8, 10.24, 8.192, ... are
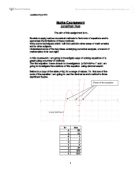
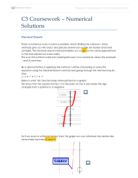
To apply various numerical methods to find roots of equations and to appreciate the limitations of these methods
Maths Coursework Jonathan Nye The aim of this assignment is to... Be able to apply various numerical methods to find roots of equations and to appreciate the limitations of these methods; Know some techniques which I will find useful in other areas of mathematics and in other subjects; Understand some of the key ideas underlying numerical analysis, a branch of mathematics in its own right. In this coursework I am going to investigate ways of solving equations of a graph using a number of methods. The first equation I have chosen to investigate is 'y=2x³+5x²+x-1' and I am going to investigate the solutions of this equation using decimal search. Bellow is a copy of the table y=f(x) for a range of values. To find one of the roots of the equation I am going to use the decimal search method to three significant figures. X= Ans -4 -53 -3 -13 -2 -1 0 -1 7 2 37 3 01 4 211 There are three changes of sign in the table above, which correspond to the three changes of roots on the graph. I am going to prove this is the case for the change in sign between y=0 and y=1 As can be seen from the table below, when focussed down to one decimal place, the sign change lies between 0.3 and 0.4. This shows that the root I am trying to find lies between these two values. X= Ans 0 -1 0.1 -0.848 0.2 -0.584 0.3 -0.196 0.4 0.328 0.5 0.6 .832 0.7 2.836 0.8

Anthropometric Data
Coursework portfolio-Investigation 2 Using and applying statistics Anthropometric Data During this coursework I will be investigating the relationship between two of the data types. The main point of this coursework is focusing on the linear regression. Data was taken from Blackboard which contains anthropometric data from a large sample of children and young adults. This date result was taken in USA by the Consumer Product Safety Commission (CPSC). From this information given I can observe that there may be some errors due to data input in the result taken, it may be that the data was collected in 1977 and during these times some techniques used in collect may be inefficient, some value may be incorrect due that it is a secondary data. Has there will be some limitation in using the data again. From the data obtained I have decided to choose foot breadth and foot length has I feel that this information will be useful to design children soaks which could be sold in retail outlets. The chosen age range from 2-2 1/2 years of age. This will be targeted at female in their gender group. Table to showing 30 sample of foot length (mm) and foot breadth (mm) Female FOOT LENGTH (MM) FOOT BREADTH (MM) AGE (MONTHS) 31 62 24 32 60 24 23 53 24 34 53 24 35 59 24 35 56 24 56 58 24 31 53 25 40 60 25 37 60 25 37 56 25 19 52 26 42 63 26 40