The methods I have used to establish that inequalities exist between different wards in Northampton are: Primary:Affluence Surveys
'Inequalities exist between different wards in Northampton' A comparative study of four wards within Northampton Borough - Abington Eastfield Headlands Weston Contents o Introduction o Methods o Results and Analysis ?Quality of Life Questionnaire ?Environmental Quality Survey ?Affluence Surveys ?Cars in the wards ?Cars per household ?Tenure of household ?Unemployment in Northampton - Choropleth map ?Multiple Deprivation Maps ?Photographs ?House prices o Conclusion o Evaluation o Bibliography o Maps of Northampton Borough Introduction Northampton is a town located in central England with a population of 198000. Northampton grew rapidly in size in the 19th century due to the shoe trade. This was the dominant industry in the 19th and early 20th century although started to decline in the 1920s and 30s. Today the main industries in Northampton are financial services, soft drinks, cosmetics and brewing. There are many different wards within Northampton and I believe there are differences between them all. I hope to find out whether there are inequalities between these wards. The wards I will be focussing on are Abington, Eastfield, Headlands and Weston. I will need Primary and Secondary data on people's attitudes in the wards, population, wealth and appearance. I will collect this data by taking photos around the wards, filling in affluence
How to lie with statistics
How to lie with statistics using statistics in media is a good way to persuade people Nowadays, we are all becoming aware of the fact that using statistics in media is a good way to persuade people. The only problem is that statistics can be used to manipulate data in the way we want. Some of the techniques for data manipulation are going to be uncovered in this article. As a result, people, who believe in statistics from media, are in danger of being manipulated. Mark Twain once said: "there are three types of lies: lies, bare lies and statistics". So the main argument of this essay is: "statistical analysis is a mathematical way of making some inference about the data or summarizing it, hence the data analysed using formal methods is unbiased". In the first passage I would like to discuss the fact that averages hide a lot of information. Afterwards, I would like to present a case of O.J. Simpson and incorrect interpretation of conditional probabilities, which is a good example of unwarranted assumptions or in particular Black-and-White thinking. Final argument is how important is to make correct assumptions also known as false or misleading presuppositions. The first argument is that: "there are several types of averages such as median, mode and mean, so averages hide a lot of information" . Even though in most of the cases arithmetic mean is used as an average,
Four factors that determined the choice of car; miles per gallon, horsepower, service interval and price. Utilising SPSS, the subsequent report will aid in describing, manipulating, analysing and interpreting this sample of collected data.
Contents Table 1 Introduction.................................................................. .........3 2 The Sample............................................................................4 3 Description of Data....................................................................5 4 Bivariate analysis of data............................................................12 5 Conclusion.............................................................................19 Bibliography & References......................................... Introduction A random sample of 20 car users were consulted about four factors that determined their choice of car; miles per gallon, horsepower, service interval and price. Utilising SPSS, the subsequent report will aid in describing, manipulating, analysing and interpreting this sample of collected data. It will see if there is a relationship between variables and if one variable can predict another. The report will be split into the following sections: 2- Display of data that is to be used in SPSS. 3- Description of data using appropriate descriptive statistics 4- Using appropriate techniques to see if there is a relationship between variables and to see if one can predict another. 5- The report will conclude with a summary of all the findings. 2 The Sample The following is the data drawn at random from 20 car users. The
A Critical Appraisal of Three Research Studies Related To Peripheral Venous Cannulae and the Incidence of Phlebitis.
A CRITICAL APPRAISAL OF THREE RESEARCH STUDIES RELATED TO PERIPHERAL VENOUS CANNULAE AND THE INCIDENCE OF PHLEBITIS. INTRODUCTION It is widely acknowledged that intravenous therapy is an integral part of total patient care of many hospital patients. (Goodinson 1990, Stonehouse 1996, Parker 1999). A variety of devices are used to deliver intravenous fluids, medication, total patient nutrition and blood products. The most common delivery method being by the percutaneous insertion of a peripheral venous cannula. According to Campbell (1998) twenty five million NHS patients per year are estimated to receive some form of intravenous therapy via a peripheral route. Peripheral venous cannulation has been associated with sepsis that causes substantial morbidity in patients, prolonged hospitalisation and increased hospital costs. (Maki 1991 cited in Campbell 1998 p1308, Pearson 1996 cited in Scales 1997 pS4, Curran et al 1998). Three main theories appear to provide a basis for predicting the occurrence of phlebitis. Physical theories support the premise that veins are traumatised by physical contact with organic or inorganic materials, The principle of the septic theory suggests that phlebitis develops as a direct result of sepsis or infection. Whilst Chemical theories propose that phlebitis is caused by the irritation of the vein wall by infusion fluids. (Campbell 1998). However,
Qualitative research - assignment 1
Qualitative research - assignment 1 There are many different types of data. These are Continuous data is data that can take any value for example time or distance. Unlike continuous data discrete data is numeric data that can take only a limited number of values such as number of people or heart rate. Nominal data (sometimes referred to as discreet data) is data that can be grouped in to categories. It is some times called frequency data because it indicates the number of times a piece of data has come about. A good example of nominal data is where in the country people live. For example Manchester, Nottingham. Whereas Interval data is measured on a scale that has equal number of units or intervals and is accepted as a physical unit of measurement. But does not have an absolute zero value, for example the Fahrenheit temperature on a thermometer. However Ratio data does have an absolute zero determined by nature. For example height, weight. (Interval and ratio data are a further type of numerical data. They are two different classifications of data but due to there many similarities can sometimes be classed as one.) ratio data is measured on a ratio scale similarly to interval data it has equal numbers of units or intervals, It uses zero to represent a missing value and it is impossible to have a negative value. An example of this would be distance covered on the bruce
Статистика
A gifted designer or just a daughter of one of the major shareholders of the Wimm-Bill-Dann holding? Many people adore her sense of style and colorful clothes, others believe that her models are vulgar and tasteless. Anyway, Kira Plastinina, a young designer, who was able to take over a certain market segment almost overnight, is one of the most discussed people now. A 14-year old girl creates clothes and accessories for younger teenagers. Although the company was established just in 2006, Kira Plastinina is a well-recognized brand making rather huge profits now. The first idea of starting this business belongs to Kira's father Sergej Plastinin, one of the major shareholders of the Wimm-Bill-Dann holding, who also was the first and main investor. Daddy saw that his little daughter likes to draw clothes and sew for her dollies and decided to please his kid and at the same time start a successful family business. In 2006 a team of managers set in building the sales network, consisting of several fashionable stores in Moscow and regions. The first boutique was opened in last February and now they are planning to expand and open 15-40 more stores. Price policy, according to Sergej Plastinin, is simple: "We should be cheaper than Zara and more expensive than Jennifer". As for Kira, she mentioned in her interview that she is only a designer and her father deals with all the

Statistics Unit 1 IP
Running Head: DATA ANALYSIS Data Analysis Jennifer Brown American Intercontinental University Data Analysis Statistics is defined as "the science of conducting studies to collect, organize, summarize, analyze, and draw conclusions from data" (Bluman, 2008, p. 3). There are two types of data: qualitative and quantitative. Qualitative data is categorized while quantitative data can be ranked. In order to give people further understanding, this data can be organized by using a method called frequency distribution. This means that the data collected is shown in table form utilizing classes and frequencies (Bluman, 2008, p. 35). Once the data has been organized using frequency distribution the data is then presented in graph form. The data collected is then summarized. Measures of tendency include mean, median, and mode; however, not all of these apply to both qualitative and quantitative data. Measures of variation tell the spread of the data set. Variance and standard deviation are two measures of variation. This paper will analyze one qualitative variable and one quantitative variable of a predetermined data set and cover how to analyze this data. I have chosen to analyze the qualitative variable of gender and the quantitative variable of overall job satisfaction. Qualitative Variable - Gender Gender was chosen as my qualitative variable because gender is categorized in

EXPLAIN THE RANGE OF RESEARCH METHODS USED BY SOCIAL SCIENTISTS TO COLLECT DATA.
DEBORAH KEENAN RESEARCH METHODS EXPLAIN THE RANGE OF RESEARCH METHODS USED BY SOCIAL SCIENTISTS TO COLLECT DATA. HNC SOCIAL SCIENCES W CLASS There are a range of research methods used by Social Scientists in order to collect data. This essay will look at and examine the various types of data and ways in which they can be researched for use by Social Scientists. Primary/Secondary Sources of Data Data produced through research can be defined as either being a Primary Source of Data or a Secondary Source of Data. Primary sources of data contain facts and figures that are first hand (gathered directly by the researcher). Normally this would be through observation, interview, social surveys, questionnaires or Case Studies. Secondary sources are those which are gathered from research by others or from information already within the public domain and can be valuable or useful to re-analyse. This could be from diaries or published autobiographies or from news stories or media. Secondary sources are easier to collect than primary and they are not expensive to use. Secondary sources allow comparison between societies and allow hypothesis to be tested. The downside of these is that the researcher will not always fully know the circumstances under which they were created, how large the sample was or how it took place. With primary sources the researcher has more control of
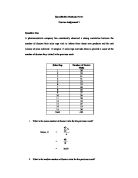
Quantitive Methods - questions and answers
Quantitative Methods Part I Course Assignment 1 Question One A pharmaceuticals company has consistently observed a strong correlation between the number of doctors their sales reps visit to inform them about new products and the unit volume of sales achieved. It samples 15 sales reps and asks them to provide a count of the number of doctors they visited in the previous week Sales Rep Number of Doctor Visits 28 2 32 3 41 4 51 5 33 6 9 7 46 8 22 9 37 0 24 1 30 2 8 3 27 4 9 5 36 Total 463 . What is the mean number of doctor visits for the previous week? Mean, = = = 30.87 2. What is the median number of doctor visits for the previous week? Number of Doctor Visits Sales Rep 8 2 9 6 9 4 22 8 24 0 27 3 28 30 1 32 2 33 5 36 5 37 9 41 3 46 7 51 4 Median = value at the observation = value at the observation = value at the 8th observation = 30 3. What is the variance for the number of doctor visits for the previous week? Sales Rep Number of Doctor Visits 28 -2.87 8.24 2 32 .13 .28 3 41 0.13 02.62 4 51 20.13 405.22 5 33 2.13 4.54 6 9 -11.87 40.90 7 46 5.13 228.92 8 22 -8.87 78.68 9 37 6.13 37.58 0 24 -6.87 47.20 1 30 -0.87 0.76 2 8 -12.87 65.64 3 27 -3.87 4.98 4 9 -11.87 40.90 5 36 5.13 26.32 Total 463 Total 403.73 Variance, s2 (for a

Expenditure per Student in High Schools :Estimation Using Cross-sectional Regression Analysis
Expenditure per Student in High Schools :Estimation Using Cross-sectional Regression Analysis Introduction The purpose of this essay is to search for a model that explains the expenditure per student in high schools. In my model I will try to answer the question that :what factors determine the expenditure per student in a district. I will use cross sectional regression to find a first order relationship between my dependent variable and the parameters it depends upon. The structure of the essay will be as following: First I will explain the data and its statistics. Then I will perform the regression and test for the CLRM assumptions. Then I will interpret the regression results. Next I perform the joint hypothesis on regressors coefficients.. Finally I will conclude the model. Data and Summary Statistics The data comes from a survey on High schools in US for different districts across different counties. In includes 1001 observation on Expenditure per student in a district, numbers of schools in the district, Student/Teacher ratio and mean score of students in tenth grade. So here the independent variables will be following: NUMBEROFSCHOOLS STUDENTRATIO (Student/Teacher Ratio) MEANSCORE (Mean score of students in tenth Grade) The scatter plots of dependent variable with explanatory variables are given in pairs as below: (b) (c) Figure 1: Scatter plot of