GIS exercise. This exercise surrounds Black Ven, the largest coastal landslide in the UK and the whole of Europe. It is situated between Charmouth and Lyme Regis, and is of great importance as both of the towns rely heavily on their landscape and tourism
Introduction
This exercise surrounds Black Ven, the largest coastal landslide in the UK and the whole of Europe. It is situated between Charmouth and Lyme Regis, and is of great importance as both of the towns rely heavily on their landscape and tourism for income. The big threat to the economic stability of the two towns is that the buildings and infrastructure may suffer if the land slides again; this would affect tourist travel and holiday dwellings as well as the living establishments of locals, and their everyday lives. This portfolio assesses this threat on Lyme Regis and Charmouth, and illustrates the extent to which Black Ven could affect the area if it becomes active again with the use of GIS analysis, LiDAR and an OS map of West Dorset.
Map 1 - Map of Local Topography © Crown Copyright/database right 2009. An Ordinance Survey/EDINA supplied service
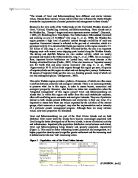
Map 1 shows the topography of Black Ven and its surrounding area. The area in grey off shore shows the sea bed, this has been used as a constant throughout the analysis as the landslide does not affect this area. The legend then goes through pink to orange as relief increases. The areas of highest relief are just north of Black Ven at Timber Hill. Buildings and infrastructure are mainly found where relief is low: less than 80m above sea-level (T Hengl, 2003.) Areas at risk from landslides are found where there is a major change between high and low relief in a short distance, e.g. at the bottom of Timber Hill where infrastructure and buildings are found to the South-West and to the East. From this map it can be assumed that a landslide at Black Ven would affect the nearby towns. The OS map shows that Timber Hill is relatively steep as it rises from 110m above sea level to 165m above sea level within the space of 170m (T Hengl, 2003), as seen in the colour gradient of the 2001 LiDAR.
Map 1 was created by accessing the OS map sy39 from digimap, downloading this and opening it in arcGIS. The 2001 LiDAR DSM and the ‘hillshade’ tool on arcGIS were used to create a shaded relief raster. This DSM was then changed to a colour ramp, which when combined with the raster, shows clearly where relief is high or low.