
Population Ecology - Dandelions
Estimating the size of a dandelion (Taraxacum Officinale) population using quadrat analysis Ashneet Singh 493629 Partners: Harsimar Virdi, Mohak Malik Mr. Crawford September 18, 2009 Purpose To estimate the population of dandelions on the school's football field. Introduction Succession is the process of the development of a sequence of communities over a period of time. There are many methods that are used in ecology to measure the population of a species. Collection of data in the case of immobile (stationary) species, such as the population of plants being studied for this investigation, was collected using line transects. These are analysis methods across a representative part of the habitat, along which quadrats are laid to cover a certain area for collecting population data. The dandelion population being studied is located in the school's soccer field, where some plants have been tempered with, due to mowing and excrements left by another species. Also, human impact (students that play in the fields) has also affected the growth of the population in various places. Variables Controlled - The size of the circular quadrat, meaning the hula-hoop, the day for the experiment, and the distance between each quadrat. Independent - The initial positioning of the quadrat from the base line (first quadrat) in the field. Dependant - The number of dandelion plants in

Population in Brazil
Sasha Zouev Geography IB, 5/09/05 IB Case Study: Brazil Population, Distribution, Density Introduction: As one of the most commonly studied populous LEDC's in the world, Brazil certainly has very interesting features and patterns regarding its population and distribution. First of all, Brazil is the largest and most inhabited country in South America, and fifth in the world. Its 8,500,000 square kilometer land area borders countries such as Colombia, Venezuela and Bolivia. The aim of this case study is to examine, section by section, the different factors that affect Brazilian population growth and distribution by looking at areas such as geographical positioning, politics, history, and generate some sort of conclusion. Distribution: Brazil's population is mostly concentrated alongside the coast. Coastal states, with a sum area of about 35% of Brazil, in fact account for about 87% of the entire population. Brazil can often be divided into clear-cut social, geographical and economic regions (figure 1). Masking half of the country, the Northern area has the dense and tropical basin of the Amazon (largest rain forest and largest river in volume of water in the world). The northeast, which is the most economically handicapped region, relies heavily on agriculture as its main economic activity. The area that is the wealthiest, and contains half of Brazils total

Britain's aging population
Britain's aging population Countries with aging populations have higher death rates. This is the case in the UK as death rates are particularly high in some of the popular retirement resorts along the south coast e.g. Brighton and Dorset. Although such services as the NHS work well in Great Britain and good doctors and medicine are keeping the elderly healthy until a much older age, this means that as the retirement age remains at sixty and people are beginning to live for longer. This is increasing the ratio of the number of people of working age (15-60\4 years) to support each person of sixty and over. As figure 3A and figure 3B show the UK to have the highest ratio against other high ratioed countries such as France. The figures show a forecast for the years to come, increasing by twenty years each time. Nearly all the way through the UK is shown to be the highest; this is due to the baby boom of the fifties and sixties. The official years of the Baby Boom Generation (1946 through 1964) saw a marked increase in the number of births in the world. Here's how the birth rate rose and fell during the baby boom years in America: 940 - 2,559,000 births per year 946 - 3,311,000 births per year 955 - 4,097,000 births per year 957 - 4,300,000 births per year 964 - 4,027,000 births per year 974 - 3,160,000 births per year There have even been books made about the baby boom:
Factors that affect the population size of an immobile population
* Al-Mashrek International School * School code: 2108 * Biology HL * Factors that affect the population size of an immobile population * Criteria: PL(A), PL(AB), DC, DPP, CE, * Bassam Al-Nawaiseh * 17/10/2007 Aim: the aim of this experiment is to study the effect of the effect of different light intensities on the growth of the pink clover (trifolium resupinatum) this is done using the quadrate method by defining two regions, region A and region B where both are squares with a side length of 10 meters. But region A is under a tree so the light intensity reaching the pink clover is low, while region B has nothing blocking the sun from it and so has a high light intensity reaching it. Now specific coordinates are specified in both regions and the quadrates are then placed at the place of the coordinates and the number of clover leaf inside them is counted then the total population is estimated using the following equation: Population size = mean number of organisms in region × total area Area of one quadrate Rationale: Plants need light for photosynthesis to occur. Photosynthesis is the production of food compounds from carbon dioxide and water by green plants using energy from sunlight, absorbed by chlorophyll i.e. Photosynthesis is how plants feed. lightlightlil 6CO2 + 6H2O C6H12O6 + 6O2 Plants use the light to break down the water molecule into oxygen

How can Governments limit population growth?
How can Governments limit population growth? By the year 2020 - population will be in excess of 8 billion per year. The world population is increasing by over 80 million per year and almost all of it is taking place in developing countries where there are more than 2 billion people under the age of 20. Rapid population growth undermines a countries ability to ensure economic growth and employment, protect the environment and provide health, education and clean water. As a preventative measure, governments aim to do as much as they can to limit population growth. But in order to prescribe policy prescriptions, the root of population growth must be highlighted. The following graph indicates the causes of population growth in the developing world. As can be seen, fertility still is 50 percent above the level needed to bring about eventual population stabilization. As many people will be born in developing countries in the next 25 years as were born in the last 25 years. Fertility is the no of live births per thousand. Government policy can effect fertility in the short run via changes in : Education, health and alleviation of poverty. Changes are coordinated by; * Policy and laws * Spending * Tax programmes - disincentives Policy and Laws * Marriage age * Breastfeeding * Women's status * Children's education and work Spending * Education * Primary health
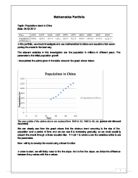
Maths Portfolio - Population trends in China
Mathematics Portfolio Topic: Populations trend in China Date: 28.02.2012 In this portfolio, we should investigate and use mathematical functions and equations that would portray the model in the best way. The relevant variables in this investigation are the population in millions in different years. The parameter is the initial population growth. I have plotted the points given in the table above in the graph shown below. *the year points of the picture above are replaced from 1950 to 50, 1960 to 60, etc. [plotted with Microsoft Excel 2007] We can clearly see from the graph above that the obvious trend occurring is the rise of the population over a period of time and we can see it is increasing gradually, so we could possibly present the model through a linear equation like: Y = aX + b where a are the variables whilst b are the parameters. Now I will try to develop the model using a linear function. In order to start, we will firstly need to find the slope. And to find the slope, we divide the difference between the y-values with the x-values. After the slope, we find the y-intercept, y1. After we find this formula, we plot it into the graph, and we get the line that approximates the original points we got from the data. Below is the graph: *graph above shows the linear function we found, plotted with the actual points. [plotted with GeoGebra4] We can clearly see
Demographic changes
Since 1900 there have been vast and numerous changes to our countries demographic trends, these all fortunately have relevant and understandable explanations. Such changes include the growing population (births and fertility), mortality and life expectancy, ageing population and family size, reasons for the change in mortality and finally reasons for changes in fertility and theories as to why couples are conceiving fewer children. Firstly, the growing population, births and fertility. It is considerably amazing that from 1901 to mid-2006 the population of Britain had grown around 22.8 million (from 38.2 to 60.0 million). Migration has increased immensely, there are shockingly more people entering the country compared to the average number of natural change (difference between births and deaths). Births rates have changed drastically; according to statistics from 1901 the growth rate was 1%, now more towards the 21st century it has dropped to 0.25%. The head factor accounting for this is in fact natural change. An example to demonstrate this is that every year since 1901 (with the exception of 1976) there has been more births than deaths. Finally the total fertility rate has declined in the UK in 1900 was 3.5 children per woman, and in 2006 it was 1.84 children per woman, these figures indicate that the number of births per woman is on a low compared to the trends 100 years

The Population Explosion- The world's population is growing rapidly; this population increase is putting pressure on the world's resources.
The Population Explosion Key idea: - The world's population is growing rapidly; this population increase is putting pressure on the world's resources. Year 100 800 900 970 995 Population in Millions 450 900 800 3600 5700 See separate sheet for graph. a. 5 billion was the worlds population in 1988. b. On my 18 birthday the population will be 6 billion; on my 60th birthday the world population will be 10 billion. c. The worlds population in 1988 was 5 billion. d. It will take 60 years for the population to double. 2. Between 1750 and 1850 there was a slow increase in the population, from 1900 to 1980 there was a more rapid increase but in 1988 there was a population explosion mainly in DC's (Developing Countries) and has carried on to the present day. 3. World population began to soar in 1988 4. The greatest increase of population has been in LEDC's (Less economically developed countries) 5. Population increase means when the number of people in the world goes up. 6. Problems it could bring Not enough Accommodation Pollution will increase Depletion of fossil fuels Fish supplies reduced Fresh water access difficult Pressure on schools/ education Cultivatable land lost Too many people per doctor Too many old people (aging
The Aging Effects of Canada's Population
The Aging Effects of Canada's Population It was 1947, World War II had finally come to a halt and Canadian soldiers were sent home. The large number of males returning back to their countries quickly made up for lost time which, in turn, triggered the Baby Boom. The United States, Australia, and New Zealand were all faced with baby booms; however, Canada had the loudest boom of all which lasted from 1947 to 1966. At the height of the boom, Canadian women were averaging four children each which explains why today that the Canadian population is approximately one-third boomers. When a new product or idea is introduced it is likely targeted to this group simply because there are just so many of them that everyone takes notice. Why did the baby boom happen? Canadians knew they could afford large families since the economy was prospering and the future seemed bright. Also, immigration rates dramatically rose in the 1950s which, in turn, resulted in additional people of childbearing age and therefore they made a central role in the boom. Once the birth-control pill was introduced in 1961 and women were becoming more accepted into the labour force there was a substantial decline in fertility over the 1960s known as the Baby Bust. While the baby boomers grew up and had offspring of their own it created a mini boom from 1980 to 1995 called the Baby Boom Echo. A direct

China Population policy was the correct approach to control an expanding population
China Population policy was the correct approach to control an expanding population China has the largest population in the World, 1 275 million inhabitants in 2000. In the 20 years following World War II China's population growth and its total fertility rate were well above the world average. Between 1950 and 1955 China's fertility rate has 6.22 whereas the average world fertility rate was 5.02. This paper will investigate China's policy to control population growth. In 1950's China had a high birth rate, 38/1000. People were encouraged to have as many children as possible because the country's leader Mao Tse-tung believed that this would lead China to become a stronger nation. At the same time, improved food supplies and medical care led to lower death rates. During the 'Great Leap Forward', 1959-1961, many of the people working in the rural areas were encouraged to become more industrialised, hence agriculture became less important. This led to disorganised farming and terrible famine. This resulted in high infant mortality rates 284/1000 and birth rates fell, the population decreased by 14 million between 1959 and 1961. (See the dip of the birth rate in the 1960's) Attempts to control the population during the 1960's were opposed by the Cultural Revolution. The population increased every three years by 55 million. Fear that further population increase would result in


