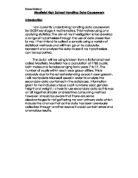
I am using secondary research because it saves time. I will not have to collect the data first hand, which will allow me time to evaluate the information found. I will research using the Internet, reports on Cadbury and magazine articles
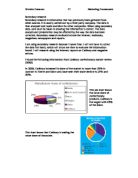
Secondary research Secondary research is information that has previously been gathered from other sources. It is usually carried out by a third party company. The data is then analysed and made available for other companies. When using secondary data, care must be taken in ensuring the information is correct. The data analysis and presentation may be affected by the way the data has been collected. Secondary research methods include the Internet, textbooks, magazines, newspapers and reports. I am using secondary research because it saves time. I will not have to collect the data first hand, which will allow me time to evaluate the information found. I will research using the Internet, reports on Cadbury and magazine articles. I found the following information from Cadbury confectionary market review (2003) In 2003, Cadbury increased its share of the market to more than 29% in contrast to Nestle and Mars who have seen their share decline to 21% and 20%. This pie chart shows the value share of confectionery products. Cadbury is the largest with 29% of the share. This chart shows that Cadbury is leading the value share of chocolate. The UK confectionary market continued to show growth in 1999, driving sales of 5.5 billion. Chocolate sales account for around 70% of the confectionary market, at 3.5 billion, while the remaining 30% is made up of sweets, worth more than

Guestimate - Data handling coursework
Data handling coursework Introduction For this coursework I am going to ask 25 males and 25 females to estimate a line and an angle. Once they given an estimate of the line and angle I record the data onto a spreadsheet. From this I will create graphs and I will work out the mean median and other things. I am going to analyse my graphs and charts according to my hypothesis. Factor considered I think there is a relationship between estimating angle and lines. People tend to be more accurate on estimating lines because people are more focus on it rather than when they are estimating angles they less concentrate. Another reason is that the understand lines much better than angles. The factors that affected a person's ability to estimate the angle or line are states below:- * Age -An elder person would have more experience in doing things than a younger person. Example younger people won't be accurate in estimating angles than older ones this would be because they have less experience & skill, therefore the percentage error will be less for an older person than a younger one. However an older person can have visual problems as they get older so this could e a factor against older people * Gender- People have stated that females are better than males in doing certain things. Example females would be more precise in estimating lines and angles. For this reason, this would be

Project proposal "Designing a simple Integrated Network for a Secondary School"
Designing a simple Integrated Network for a Secondary School Yayale Nabeel Ahmed MDX 08 Key words Internetworking, interoperability, email, database, servers, workstations, connectivity, Internet Problem definition Currently, up to 60 to 70 percent of schools in Nigeria are not computerised, so I have been authorized by a proprietor of a medium sized secondary school to setup an entirely new network from scratch for his school. The scale of the school currently is about 50 to 65 staffs and about 500 students who are dependent on the small number of computers. Because their computers are not networked, they both don't have the resources needed to keep pace and updated with technology, Internet based learning materials, communication between staffs and students. The only 11 computers the school have currently get access to the Internet using dial up connection, this as a result give them relatively slow connection and most of the time no connection. The administrative department include; the principals office, vice principal, finance office, admission office, reception. The faculty department composes of the staff room. The student department includes the physics lab, computer lab, chemistry lab and biology lab respectively. These entire departments don't have any option of sharing information but to move up and down from one room to another physically. With this, you
Maths Data Handling
Introduction The line of enquiry that I have chosen is 'The relationship between height and weight'. To investigate this line of enquiry, I am using secondary data (that I will acquire from the internet) so that there will be no bias and unfairness that is obtained through the collection of primary data in questionnaires. The data that I am using is on a fictitious school, Mayfield High School, but the actual data has been obtained from a real school. This is useful as there will be five age groups that are considered in the whole investigation. However the age groups that lie below the age of 11 and age groups that lie over the age of 16 will not be thought of in the investigation as it stretches out of the age boundary in Mayfield High School. There are 1183 pupils in Mayfield High School and I will be using the following pieces of data on each pupil: - year group, age, gender, height and weight. This means that I will have a total of 5915 datum points to work from. This is obviously too large so I will use a sampled piece of data of 100 pupils. Since I will be using stratified sampling I will need to know how many boys and girls there are in each year. The table below shows the exact figures. Year Girls Boys Total 7 31 51 282 8 25 45 270 9 43 18 261 0 94 06 200 1 86 84 70 I will need this table throughout my investigation so that I can construct
Data handling - Mayfield high school.
Year 11 Data handling coursework- Mayfield high school Subject of the investigation The purpose of this investigation of data handling is to investigate the rate of growth of males and females. The male sand females are pupils of the Mayfield high school in the North of England. I obtained the data from the Internet, of the pupils: Names, gender, year group, age, height, weight and I.Q. I sorted the data, to which I only needed the pupils year group, gender, height and weight. To investigate the data, I am going to need to create a random sample of pupils equally from year group and gender, down from 713 pupils because we only need years 7, 9, and 11, to just 300 pupils. The data is all set out in the form of a spreadsheet on the program Microsoft Excel. Working out the amount needed for our random sample As we only need 300 pupils' data out of the 713 pupils, we are going to have to find a way to scale it down, fairly and evenly, so that the investigation is a fair test. Year group Boys Girls Total 7 51 31 282 9 18 43 261 1 84 86 70 Total = 713 We need = 300 To find out how many pupils I need for a random and equal sample, I am going to work out what number, if the number of pupils was 300, of years 7, 9, and 11, boys and girls I will need: Number of year 7 girls: (300?713)?131= 55.12= 55 Number of year 7 boys: (300?713)?151= 63.5= 63 Number of
Investigating the relationship between height and weight for the pupils in a secondary school.
AS Level Statistics Project Investigating the relationship between height and weight for the pupils in a secondary school Table of Contents Introduction 3 Primary Data by Direct Observation 3 Secondary Data 3 Hypotheses 4 . Distribution 4 2. Comparative 4 Methods 4 Data Collection 4 Choosing the Data 4 Stratified Sampling 4 Randomised Selection 4 Analysis and Interpretation of Data 5 Data Summaries 5 Measures of Spread of Data 6 Box and Whisker Diagrams 6 Stem and leaf and Frequency Table (Boys Height) 7 Stem and leaf and Frequency Table (Girls Height) 8 Stem and leaf and Frequency Table (Boys Weight) 9 Stem and leaf and Frequency Table (Girls Weight) 10 Standard deviation and confidence intervals 11 Comparing heights against Weight for Boys 11 Correlation Analysis 11 Comparing heights against Weight for Girls 12 Correlation Analysis 12 Conclusions 13 Evaluation 13 Appendix 1 - The data 14 Introduction For this investigation, I am going to use data on secondary school pupils to find the distribution of the data and also to look for any meaningful relationships between the heights and weights of the students. When I was looking at the various things that I could study, one of the factors that I looked at was data collection. The amount of data was large, spanning across different year groups. I could have looked at the variation of weight and
Mayfield High School Handling Data Coursework
Mayfield High School Handling Data Coursework Introduction I am currently undertaking handling data coursework for GCSE key stage 4 mathematics. This involves using and applying statistics. The aim of my investigation is too develop a range of hypothesises through the use of data presented to me. I then intend to collect a sample using a variety of statistical methods and will then go on to calculate, represent and analyse this data to see if my hypothesises can be supported. The data I will be using is taken from a fictional school called Mayfield. Mayfield has a population of 1183 pupils, both males and females ranging from years 7 to 11. The number of pupils within each year group differs. This is probably due to the school extending as each year goes on. I will manipulate Microsoft excel in order to analyse the secondary data contained in the database. Information given to me includes unique pupil numbers; year; gender; height and weight. I chose to use secondary data as this was an all together simpler and less time consuming method however I should be aware that there are some disadvantages to not gathering my own primary data which include the chance that as the data has been previously collected through another source it could contain errors and anomalous results. Hypothesises Females in year 7 are taller and heavier than males in year 7. For this hypothesis I
Mayfield Data Handling Coursework
Data Handling Coursework Introduction Ideas My handling data coursework is concerning pupils at Mayfield High School. The secondary data provided on each student is: Name, Age, Year Group, IQ, Weight, Height, Hair Colour, Eye colour, Distance from home to school, method of travel, numbers of brothers and sisters, key stage 2 results in maths, science and English. My particular line of enquiry is about the heights and weights of boys and girls in all year groups. Aims The aim of my coursework is to observe if my hypotheses are correct and provide enough evidence to back my conclusion and interpretation in the end. Hypothesis My hypotheses are, . My first hypothesis is regarding weight (mass): Boys weigh more than girls. 2. My second hypothesis is regarding height: Boys are taller than girls. Purpose The purpose of my study is to find if boys have a larger height and weight than girls. This line of enquiry is based on an external issue I have come across in daily life. It is the recommended daily calorie intake for boys and girls. (Shown below) This in my opinion affects the weight of boys and girls because it indicates that boys' recommended calories are more than the girls'. Although there is a chance present that this theory is false as most individuals will not follow this recommendation as they can exceed or reduce the amount of calories and taking into
What are the advantages & disadvantages of secondary legislation.
"What are the advantages & disadvantages of secondary legislation" When looking at the question of the advantages and disadvantages of Secondary Legislation it is first important to establish its advantages and disadvantages as compared to what. That is, what are the other types of legislation that command over what goes on in a society? Once this has been established it is then important to look at these different and see how they differ. Deciphering what makes a particular type of legislation that type can do this. Who makes the type of legislation? How is it implemented and to what degree of the law can it be executed. When this has been done it will be quite clear as to how one type of legislation can be more of an advantage to society than another. When this has been completed it will then be necessary to look at the role of Parliament in the implementation of Secondary Legislation. It will have to be established whether secondary legislation takes away from the law making power of Parliament. Once this has been done an analysis into how widely Secondary Legislation is used will answer the question of whether Parliament is abdicating from its power. In the UK there is a system of checks a balances so that no on e organ of government can dominate the legislative process. In order to facilitate the workings of Parliament delegated legislation is used to speed up the
Data Handling - GCSE Coursework
Maths Coursework - Data Handling Hypothesis and Planning My hypothesis is that there will be a relationship between pupils' heights and weights. I predict that generally pupils who are taller will weigh more. In order to do this I am going to choose them from Year 11 because I think that this people are more likely to be more fully grown than any of the younger years and may be more in proportion. In order to carry out my investigation, I should first select the data I will use. I'm going to do this randomly to make it fairer. I can use my calculator to help me choose using the random sample button. When I press shift, RAN#, it will give me a random number between 0 and 1. I need a random number between 1 and 84 for the boys, and between 1 and 86 for the girls, so I should multiply this number by 84 or 86 and round to the nearest whole to get my random sample number. I can then look for this number piece of data on my table. Once I have collected the data I am going to put it into tally charts. Using a tally chart means it is easier to work out the totals for cumulative frequency graphs and is also easier to make a histogram from. A stem and leaf diagram will also make it easier to find the median of the data. I should use the median, mode, mean and range to help me make some simple generalisations and statements about my hypothesis. I can use them to compare the boys and


