
Report on house prices
Assignment for 4ECQ402 Exploring Business Data A REPORT ON HOUSE PRICES CONTENTS Introduction 3 Overall distribution of house prices 4 Proportion of houses with garages I 5 Proportion of houses with garages II 6 Relationship between House price and Garage 7 Relationship of House price to Size 8 Relationship between House price and Distance 9 House prices in the UK for different regions 10-11 Appendix - Average dwelling prices_________________12 Introduction For this assignment I will be using the data set 'House Prices', which gives some results from a survey relating to house prices in 5 different small towns. I am going to explore this data file using Minitab, and write a report on my findings. The variables in the data set are: Price House price in £000 Bedrooms Number of bedrooms Size Size of property in square feet Distance Distance from nearest large town Town Which of the 5 towns the property is in Garage Whether property has garage (0 = no, 1 = yes) Baths Number of bathrooms (lavatory and washbasin = 0.5) Note: In the following report, the value of price is in £000. And relating to whether the house has a garage, '0' represents 'no' and '1' represents 'yes'. Look at the overall distribution of house prices in the survey. Descriptive Statistics: Price Variable N Mean Median
Lawrence Klein Project
attribute ECON2032 Project May 2007 Introduction Lawrence Klein (born in 1920) is an American economist. Much of Klein's work focused on macro economic modelling and Klein developed several computer models. This project will focus on Klein's 'model 1'. Klein Model 1: Exogenous variables: G T W2 t Model 1 was created to try and explain the cause and effects of the great depression in USA in the 1920s and 1930s. It tries to explain why the economy did so badly at the end of the 1920s then eventually recovered towards the end of the 1930s. Basic Time Plot Analysis We have plotted three important variables to graphically explain what Klein was trying to explain in his model. These three variables are consumption, investment and private wages. Figure 1 shows the consumption levels every year from 1921 to 1943. In 1921 consumption is 39. Consumption rises each year steadily until 1930 where consumption is at 57.8. Consumption falls in 1931 and rapidly. It falls for a further two years and reaches a level of 45.6 in 1933. In 1934 the consumption levels start to rise again and do so for the next ten years except for a small dip in 1939. Figure 2 shows the investment levels from 1921-1943. Investment starts at 2.7 in 1921. Here it falls the next year to -0.2%, after this in general it rises each year until 1927 where it reaches 5.6%. In the next six years it falls to -6.2%
GDPs Limit to measurement of welfare and happiness
GDPs Limit to measurement of welfare and happiness GDP (Gross Domestic Product) is a measure of output of an economy resulting from production of marketed goods and services within the national boundary. Goods and services which are valued at their market price and output is gross capital depreciation. GDP, national income per capita is often used as an indicator of living standards or happiness. There are number of weaknesses in measuring per capita income and happiness, GDP is a measure of output rather than income. Also the residents of a country can derive income generated by assets overseas. GDP also excludes production that is non-marketed; this includes housework and other standards of living. It also does not take into account the non material factors that might be viewed as contributing to standards of living (life expectancy, pollution levels and civil liberties). It is also mentioned that "standard of living is best measured through real GDP per capita as it encompasses all earnings accruing to residents of a country." It is emphasized that increased productivity is the key to boosting real GDP per capita. A higher standard of living with a higher level of consumption, but the key to long-term Welfare is productivity. Productivity which consists of three factors of production: labour, materials, and capital. It measures the efficiency of people, capital resources

How the Exchange Rate Mechanism attempts to control fluctuating currencies between its members.
The Single European Market. Outcome 1. Suzanne K Menzies. Tutor: C Masterton. Contents. Introduction 3 Part 1 A brief description of the Exchange Rate Mechanism. 4 - 6 Part 2 How the Exchange Rate Mechanism attempts 7 - 8 to control fluctuating currencies between its members. Part 3 The ECU's 'Basket' of currencies. 9 - 10 Part 4 The principle role of the ECU. 11 - 12 Part 5 The purpose of the European Monetary Co-operation Fund. 13 Conclusion 14 Bibliography 15 Appendices 1 - Basket Quantities 1991 & Composition of ECU 1979 - 1989 16 2 - Key events in the ECU's 1981 - 1999 17 3 - History of the Euro - BBC News 18 4 - Convergence Criteria - BBC News 19 Introduction. A European Monetary Union has been high on the EU's agenda for some time. The belief is that full harmonisation of Europe has to be on an economic, social, political and monetary basis. Now, with the implementation of the Euro becoming legal tender last January (2002), this aspiration has been instated. The Euro, established by its forerunners: the ERM and ECU, as it expands will offer vast provisions, in the aim of developing economic monetary, power, aid and achievements in the long run. This assessment explores the European Monetary field, hopefully giving some coherence to it along the way. Part 1-

Subprime Effect on U.S. Unemployment
Introduction In recent decade, mortgage brokers in the United States (U.S.) engaged heavily in securitization of subprime mortgage loans into high yield mortgage-backed securities being sold to investors, pension funds and financial institutions. With this profitable model, it generated additional funding to create more loans, resulting to loose lending practice, poor credit rating, and overleveraging (BBC, 2007). Sudden increases in foreclosures from second quarter 2007 led to job cuts in constructions and financial activities. With the U.S. subprime market unfolded, how did the current unemployment rate reach 5% from 4.4% in December 2006 (Appendix A)? This essay attempts to explain the magnitude of the U.S subprime crisis and analyze the impact on its unemployment. Causes of the Subprime Crisis "Subprime" refers to borrowers with less than good credit ratings, and unable to qualify for prime conventional loans (Wikipedia, 2007). The Mortgage Asset Research Institute published a survey that borrowers stated income with little documentation and most overstating income of more than 50% (Sharick, M. et. al. 2006, p.12). Increased foreclosures resonated from borrowers' inability to meet their increased loan installments through Adjustable Rate Mortgages (ARMs). Example, ARMs offer low fixed interest rate for two years with periodically adjustments based on selected indexes
Friedman and Full Employment Theory
Friedman is also famous for a second theory, this one containing much more merit. It's called the natural rate of unemployment. (1) To understand it, we should review the early Keynesian goal of reaching "full employment." "Full employment" does not mean 100 percent employment. For various reasons, the unemployment rate cannot be reduced to zero, if only because people are always being fired, laid off or moving between jobs. But even granting that unemployment can never be completely eliminated, it still might be possible to ensure that anyone searching for a job can find one reasonably quickly. Economists call this happy state of affairs "full employment." How can it be reached? Early Keynesians believed that they could achieve it by expanding the money supply. Of course they could not overdo it. Keynes himself knew of this danger when he wrote Tract on Monetary Reform in 1923. The central bank could expand the money supply right up to the point where full employment was reached; after that, any monetary expansion would result in inflation. The question was how much to expand. An apparent answer emerged in 1959, when British economist A.W. Phillips discovered a relationship between wages and unemployment in British historical statistics. When unemployment was high, wages had fallen; when unemployment was low, wages had risen. A look at American statistics revealed the same
Do higher wages cause higher prices, or do price rises cause wage rises?
Do higher wages cause higher prices, or do price rises cause wage rises? Do higher wages cause higher prices, or do price rises cause wage rises? What are the policy implications in either case? Inflation involves changes in both prices and wages, and can be initially caused by either. Therefore, in this essay I will look at two cases of inflation, one which is caused by a change in aggregate demand, and one which is caused by a change in aggregate supply. Both of these will have relation to prices and wages. I will then examine the fiscal and monetary policy responses available to government in either case. In the first case, a rise in aggregate demand could lead to inflation. This kind of inflation is referred to as demand-pull inflation. An initial increase in the level of aggregate demand could be caused, for example, by a rise in government spending. This would cause the aggregate demand schedule to shift to the right, and the short-run equilibrium point would move upwards and to the right along the short-run aggregate supply curve. This would lead to a rise in prices as well as an expansion in GDP. However, this would place the economy above long-run aggregate supply, and therefore producing more than its long-run potential. This means that the economy is operating with unemployment lower than the natural rate, and the ensuing labour shortages will lead to a
Monetarism: A Historic-Theoretic Perspective
Monetarism: A Historic-Theoretic Perspective The first and most important lesson that history teaches about what monetary policy can do -- and it is a lesson of the most profound importance -- is that monetary policy can prevent money itself from being a major source of economic disturbance.1 Economists usually view their discipline as a progressive science in which new ideas constantly replace inferior old ones. A look at the history of economic thought suggests that new economic doctrines emerge primarily as an alternative or a counter reaction to previously existing orthodoxies. As a result of these "intellectual revolutions," new schools of economic thought form and develop, challenging the validity and diminishing the influence of their predecessors' beliefs and ideas. Modern monetarism emerged in the 1950s as a reaction to the then-prevalent Keynesian approach to macroeconomic theory and policy. In 1956, the American economist Milton Friedman attacked the income-expenditure approach of John M. Keynes and proposed an alternative macroeconomic theory that viewed money as the root source of major economic calamities. The counter-revolutionary Friedman resurrected older economic doctrines in building his monetary theory and his ideas, expounded in the classic Studies in the Quantity Theory of Money (1956), marked the beginning of modern monetarism as a distinct line
'The Most Significant Outcome Of The New Economic Model In Latin America Is A Rise In Poverty And Inequality'. Discuss. The New Economic Model (NEM) was a system that was put into action following the 1982 debt crisis
'The Most Significant Outcome Of The New Economic Model In Latin America Is A Rise In Poverty And Inequality'. Discuss. The New Economic Model (NEM) was a system that was put into action following the 1982 debt crisis, in Latin America. Basically Latin America could not continue using the same economic strategies, as they were faced with debts, which they could not afford to repay. They tried a number of different methods, in looking to solve the debt crisis, including large-scale import substitution, but after the short-term positive effects of these began to subside, they were in search of a new economic strategy, which the NEM turned out to be (Bulmer-Thomas. 1996. p1). My aim is to look over the NEM in general, in Latin America and assess the results of the scheme. I will look at the results and will gauge the major outcomes resulting from the NEM and state what I believe the most significant affects are. It is important to look at the particular groups of people that have been affected, because a positive outcome for a member of the social elite may not be a positive outcome for the general public. In greater depth I will focus on poverty and inequality, in order for me to find out to what extent the overriding statement is true. The debt crisis The NEM was implemented as a retort to the debt crisis. The debt crisis occurred and Latin America had to sort itself out
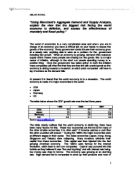
Using Blanchard's Aggregate Demand and Supply Analysis, explain the view that the biggest risk facing the world economy is deflation, and assess the effectiveness of monetary and fiscal policy.
"Using Blanchard's Aggregate Demand and Supply Analysis, explain the view that the biggest risk facing the world economy is deflation, and assess the effectiveness of monetary and fiscal policy." The world of economics is a very complicated area and when you are in charge of an economy you have a difficult job on your hands to ensure the growth of the economy. Every government wants the see their economy grow at a steady rate, anything else is seen as a problem for the government including fast growth. When an economy is growing, demand often outpaces supply which means many people are chasing too few goods, this is a major cause of inflation, although in the short run people spending money is a positive thing. Once the government has taken action to kerb the inflation many companies will often find that they are then left with unsold goods as the economy is sliding towards a recession, at which point companies will have to lay of workers as the demand falls. At present it is feared that the world economy is in a recession. The world economy is made of 4 major economies in the world: * USA * Japan * Germany * UK The table below shows the GDP growth rate over the last three years: 999 2000 2001 USA 4.5 4.2 .2 Japan .8 2.4 -0.4 Germany .4 3.0 0.6 UK 3.5 3.1 2.2 Source: www.worldbank.org The table clearly outlines that the world economy is