Critical Analysis of a Research Paper The paper I am going to analyse is taken from the journal of strength and conditioning research. It was written by Ledford, A., and Branch, J,D. The paper focuses on the effects of creatine supplementation on peak
Critical Analysis of a Research Paper The paper I am going to analyse is taken from the journal of strength and conditioning research. It was written by Ledford, A., and Branch, J,D. The paper focuses on the effects of creatine supplementation on peak power production and work capacity. The author develops this theory by performing repetitive wingate tests in women. The paper includes research methods and statistical results. Title The title of the paper is very simple and direct. It has all the key words needed to notify the reader of the subject of the research. The language is specific to sport by using key terminology like 'creatine' and 'wingate test.' The title is written in a large bold font which signifies the importance of the text. The authors are listed in a smaller font, informing who contributed to the paper. Abstract This section elaborates on the title and declares the hypothesis of the study. It is very informative and clearly states what the research is about. When people access the journal via the electronic database, this small section is understandable, interesting and makes the reader want to carry on. The abstract follows on to give a more detailed account of the research with a summary of results. There is also a sentence at the end which outlines the conclusions found. It states that 'the practical application of the study is that 5 days of
Quantitative Analysis for Business.
Quantitative Analysis Quantitative Analysis for Business Summarising Data Part of the reason why we analyse data is to see patterns. It is difficult to see patterns in data without summarising the data in some way. The most common way to summarise data is to convert the data into a summary table, into a graph or picture, or to use summary measures like the average. The benefit of this type of summary is that it gives us an instant picture of what is going on in our data set. The problem is that we often lose the detail of the original data. Frequency Distributions Suppose you have collected some data on the number of children in people's families. The variable we are measuring is 'number of children in the family'. The values that this variable can take are numbers like 0, 1, 2 or 3. These are discrete data, in that they can only be measured as whole values. You can't measure children in ever more accurate values like you can time or distance. When you can measure data in continuously more accurate measures (providing you have an appropriate measuring instrument), we call this type of data - continuous data. Start by turning your data set on the variable, number of children, into a frequency distribution. A frequency distribution is a table that shows the values that a variable can take on the left hand column and then the frequency with which we observe the

Practical Applications of Statistical Concepts
Practical Applications of Statistical Concepts Charity Maynard QNT 530: Statistics & Research Methods for Managerial Decisions Sid V. Soben, PhD, Instructor September 29, 2004 Practical Applications of Statistical Concepts Statistics are objective measurements that describe a characteristic of a sample according to Lind, Marchal, and Mason (2002). Statistics provide useful information for observers involved in many different aspects of life such as sports, business, or politics to name a few. A thorough understanding of statistical concepts will allow managers to make informed decisions as they become skilled in identifying trends and predicting future outcomes thus, increasing their probability for success. Skilled managers will be better prepared to make informed business decisions as they learn to practically apply statistical concepts such as central tendency; mean, median and mode; sampling; and the empirical rule. To begin with, statistics can be presented or measured in various forms. A measure of central tendency as defined by Lind et al. (2002) is a single value that summarizes a set of data by locating the center of the values. This typical single value can be used by managers to transform raw data into something useful. For example, knowing the average cost of hiring a new employee may prompt managers to explore less expensive retention programs among

6 Month Report on the Audience Profile of the Science Museum (March-August 2001)
SCIENCE MUSEUM Visitor Research Group Profile of the Museum's Website audience Report 1: Pop-up survey conducted 6 August 2001 Kate Steiner, Alex Burch & Ben Gammon September 2001 Summary * Overall the profile of the Museum's virtual visitors was strikingly similar to that of its physical audience. * There were no significant differences between the virtual and physical audiences in gender, educational attainment, country of residence, geographical spread within the UK, or ethnicity of visitors. * Like physical visitors, most virtual visitors are white, live in the UK (mainly in London and the South East) and have a high (i.e.graduate) level of education. * Compared to their numbers in London and the South East, people from the Black community are under-represented in the virtual audience, while Asian people are slightly over-represented. Again this reflects the profile of physical visitors. * The age profile of virtual visitors did differ significantly from physical visitors. Fewer children visit the Website than the physical Museum. Most virtual visitors (84.5%) are adults aged 19-59. * Most of our Website visitors access the Internet from home or work. * More than three quarters of virtual visitors are first-time visitors. * Almost three-quarters of virtual visitors are looking for information about visiting the Museum. INTRODUCTION The following

maths cars coursework
Aim I am aiming to find out whether used cars have a correlation between there engine size and there insurance group. I will also aim to find out the comparisons between the most popular colours of the cars shown on my data sheet provided. Introduction During this investigation, I am investigating correlations and comparisons between used cars sales. For each I will chose 18 cars at random, this will therefore calculate to 36 cars. The reason for choosing 36 cars is because there are 360 on a pie chart and consequently it will be easier to portray on the pie chart. I will use the random button on my calculator; the sequence I used to do this was; 66 SHIFT RAM This sequence will make my investigation unbiased and a fair test and additionally more quick and efficient. Once my numbers are highlighted on the data sheet, I will go on to write a hypothesis for both correlation and comparisons. Furthermore, all of the results and data I collect during the investigation, will be put into clear and well laid out tables, which can be used to produce other graphs such as scatter diagrams and bar charts. If there is any data missing from my results I will have to show this clearly on my graphs and tables, scatter diagrams will be very helpful if this occurs for the anomalies will clearly state an incorrect or missing piece of data. Moreover if I were to add a line of

Discuss the Contention that the media produce partial and exaggerated images of Crime, In what ways might these influence Public Perceptions of Crime?
Discuss the Contention that the media produce partial and exaggerated images of Crime, In what ways might these influence Public Perceptions of Crime? The Media is often accused of playing a role in the creation of partial and exaggerated images of crime amongst the public. This essay will begin with the assumptions that the media does indeed produce partial and exaggerated images of crime, and this influences public perceptions of crime in two main ways, both leading to the creation of fear of crime amongst the public. The ways in which the media does and the processes at work within the media are important and will be explained, using relevant examples from contemporary society. The two main ways in which peoples perceptions of crime are altered by the media is firstly, people perceive that there is more crime than there actually is, also the type of crimes which people think are most prevalent, such as murder, are often altered by partial reporting by the media. This creates, as I have already stated, an increased fear of crime. There are some key terms which are used within this particular area; these will be explained within the essay also. One of the most important sociological terms when looking at media and crime is that of a "moral panic". One of the most influential and important theories of this was put forward by Stanley Cohen, in assessing deviancy

Sexual attitudes and lifestyles.
a) Please give details of the research on which you are reporting Title: Sexual attitudes and lifestyles Author(s): Anne M. Johnson, Jane Wadsworth, Kaye Wellings, and Julia Field Date of publication/completion: 1994 Publisher or source: b) Outline of the Research design (210-300 words) You should state the objective of your chosen piece of research, and use this section to outline how the researcher/s carried out their research. You should describe the aims of the research and the research methods that were used. (You may wish to consider sample size, access to sample, ethics etc.) Johnson et al aimed to research sexual behaviour due to the emergence of AIDS in the 1980s. Before this study, the study of sexual behaviour was much neglected due to attitudes towards it. The Conservative government declined to finance the survey due its belief that personal business should be 'kept behind closed doors'. People working in the fields of fertility, sexual health and education were hindered in their work by the shortage of data. Luckily the 'Wellcome Trust' funded the research. With the emergence of the AIDS epidemic, up-to-date research was required. This study was the largest and most comprehensive survey of sexual behaviour ever conducted. The information was collected from over 19,000 randomly selected British representatives selected through the Post office postcode

An investigation to determine the effect of temperature on the permeability of beetroot cells.
Katie Ruck An investigation to determine the effect of temperature on the permeability of beetroot cells Evaluation Although an apparent trend is illustrated by the experimental data plotted, I am reluctant to formulate a valid conclusion on the effect of temperature on the permeability of beetroot cells due to the variability of the results obtained. Although five repeats were performed, the data collected is not reliable because of variation within the sets of results. This could have been due to various limitations of the experiment. At 30oC for example, the reading for absorbance of light in arbitrary units, was 0.12%. When compared to the results collected from other repeats at this temperature, this appears to be an unusually high value. Further examples of possible anomalous data were 0.03% at a heat treatment of 40oC together with 0.06% at 50oC. If these anomalous results were not included in the mean absorbance plotted, this could have had a significant effect on the overall conclusion. For example, had the reading at 40oC not been included in the mean, the reading plotted at this temperature of heat treatment may not have been lower than the mean result plotted at 30oC, as is shown on the graph by a slight dip. The size of the range bars causes one to question the reliability of the experimental data. These are especially large at higher temperatures of

Foundation Degree Computing - Statistical Methods
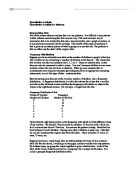
Statistical Methods By Miles Parker December 2004 Foundation Degree Computing - Statistical Methods Somerset College of Arts and Technology University of Plymouth Table of Contents Designing the Questionnaire 3 Collecting the Data 4 Data Analysis 6 Population Parameters 7 Predictions for the Next General Election 11 Limitations of the Survey 12 Location 12 Population 12 Quality of survey 12 Random Sampling or self selected data 12 Personal Questions 13 How did the Group Work? 14 Appendices 15 Appendix (A) Graphical Representation of Data 15 Appendix (B) Questionnaire 21 Designing the Questionnaire In order to design the questionnaire as a group we had to combine our thoughts and develop a questionnaire that would maximise the proportion of subjects answering the questionnaire, and obtain accurate relevant information. We decided to include questions that would prompt a response from the subject in a closed and open manner. Short simple sentences were used to minimise the subjects' confusion, we avoided negative questions where possible. We designed questions to minimise bias and we did decided to include some questions that have a grading value from 1-5. The question regarding the most important issues we allowed multiple answers to this as the subjects usually had more than one issue at the forefront of their concern e.g. 1 subject could want

Business Statistics. The aims of this report for AllRepairs mechanics are to systemectically review on the efficiency of repair staff towards assigned jobs and customers satisfaction levels towards the services provided through a series of statistic
Majoy Project : Quality Control for All Repairs mechanics May 2010 Executive Summary The aims of this report for AllRepairs mechanics are to systemectically review on the efficiency of repair staff towards assigned jobs and customers' satisfaction levels towards the services provided through a series of statistical analyses. As to maintain a high quality of service and to isolate any inefficiency in the provision of various services AllRepairs provided, the following points are concerned: * Analyses of efficiency of repairs staff as measured by time taken to undertake specified jobs * The agreed target whereas 80% of customers should be either satisfied or very satisfied with services provided Findings Maintain a good relationship with customers is one of the key to success for every businesses. Of which to maximize sales and repeat business, an excellent customers' services has been far more important. Therefore, research of statistical analyses needed to be carried out to assess whether companies have been reaching their goals. By analyzing the data consists of 293 jobs provided from branch of AllRepairs that provides refrigeration repairing services, the following results have been found: * Majority of job difficulty levels lies with standard, which is 61%, while hard job levels only consists of 11%, which is only a small part of the