Development of Quantitative and Qualitative measures of Human Impact on Wimbledon Common.
Individual Study. Development of Quantitative and Qualitative measures of Human Impact on Wimbledon Common. Abstract A vegetation analysis has been performed at four sites on Wimbledon Common SW19 London, to assess the suitability of quantitative methods for determining human impact on the succession climax. Systematic stratified sampling based on the method of Querouille (1949) has been used Based on 25 sample points per site. A test of Yoda's law; C=W? -3/2 has been performed on tree stands, where ? = density of a stand, C= dry weight of matter and w is a constant, by using a correlation test. Log (combined diameters) as the dependent variable (y) and log (distance between pairs) as the independent (x) variable. Three out of four sites gave high values of r, indicating that Yoda's law may operate on the sample sites. This is thought to reflect human management of the common over 200 years as well as the mechanism of self-thinning. Using the point quadrat method (Curtis 1949) estimates of density d were obtained as: d= 1 / l 2 where l = ? li / n , where n = sample no and l i the determined lengths from the sample points. This showed discrimination between open and closed sites. A frequency analysis was carried out on this data to find the relative dominance of species X as: Relative dominance of species x= sum of circumferences for that species/ sum of

Used Cars - What main factor that affects the price of a second hand car
Aim To investigate what is the main factor that affects the price of a second car. Hypothesis A number of factors such as age, mileage and engine size all affect the second hand price of car but the factor that I feel affects the price most is mileage the car has done. I believe this to be true because as a car travels more and more miles the engine and the other parts of the car have lot of strain put on them and so begin to wear, which then makes the car less and less reliable. Therefore this is apparent in the second price of the car. The price spread of the small sized cars will be the smallest. This is because the engine size range of the car small sized cars is quite small and as the small sized cars to not depreciate fast. The large sized car will have the largest price spread, as the engine size range is the biggest and also because luxury cars that are quite expensive tend to have large engines sizes. That is why the price of the large sized cars will be greatest. Small sized cars depreciate a lot slower in price than large engine sized cars. I believe this because small sized cars have a fairly low price any way and so the price of those cars won't drop as dramatically as others. Also small sized cars have a bigger demand than large cars as large cars are more expensive to maintain and run. Introduction In this investigation I will collect information on a
Numerical Method (Maths Investigation)
NUMERICAL METHOD INTRODUCTION It is very useful to use Numerical Method to find the roots of an equation that cannot be solved ALGEBRAICALLY. Quadratic equations in the format of can be solved by Quadratic Formula: . However, for polynomial equations, that have highest power more than 2, has to be solved through Trial and Error, which is very hard and tedious to determine their roots. Moreover, some roots of polynomial equations may be not Integer or Large numbers, which make things harder. Therefore NUMERICAL METHOD is developed to help to solve polynomial equations. In P2, we learned that there are two types of Numerical Method: * Change of Sign Method o Decimal Search o Interval Bisection o Linear Interpolation * Fixed Point Iteration o Newton-Raphson Method o Rearrangement Method About Coursework Things have to do for Coursework: * One kind of Change of Sign Method; * Newton-Raphson Method; * Rearrangement Method; * Failures of each methods; * Error Bound of each methods; * Comparison made with the three methods above; and * Ease of use and Availability of Hardware and Software to do coursework. CONTENTS: PAGE No. Description 2 Change of Sign Method and its Failure 8 Newton-Raphson Method and its Failure 2 Rearrangement Method and its Failure 7 Comparison made onto one roots of an equation with the 3 Methods above 22 Ease of use and
The average pupil.
GCSE Maths Coursework The average pupil The aim of this study is to find the statistics for the average school pupil. This will be achieved by looking at the results of a survey carried out at Jordan Hill comprehensive. Hypotheses: How the education system has changed in its efficiency, over four years. The weight of a pupil will increase with the amount of television watched per week. The hair colour of a pupil will affect their IQ. How I will achieve this? This will be achieved by using samples of the given material. Specifically a sample of 50 people will be used for the first hypothesis, and then a sample of 30 will be used for the next two hypotheses, as to not be too time consuming. I will be using a stratified sample for the first hypothesis, and then a random sample from that point forward. Why am I using Stratified and Random sampling to acquire my sample? From studying the data sheets I have decided to use a stratified sample. I have chosen this method because it would appear to be the most efficient method of sampling in order to tackle this amount of data, and I feel that the sample is plenty large enough for the results to be significant. I have also chosen a random sample because it cannot become bias, if some strata are larger than others. This is also because gender, or age will not affect the two last hypotheses. It will also provide me with

Functions Coursework - A2 Maths
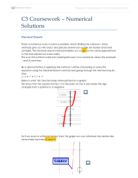
C3 Coursework: Numerical Analysis Change of sign method I want to find the roots of the equation x3-3x-1=0 to five decimal places. Consider the function f(x)=x3-3x-1; hence I want to find the roots of the equation f(x)=0. If the function is continuous in the interval [a,b], where a and b are values x could take, and either: f(a)<0 and f(b)>0 or: f(a)>0 and f(b)<0 then there must be at least one root of the equation f(x)=0 in the interval [a,b]. Therefore we are looking for a change of sign, which will then indicate the interval in which there lies a root of the equation f(x)=0. The table shows values of f(x) at integer values of x from -5 to 5. x -5 -4 -3 -2 -1 0 2 3 4 5 f(x) -111 -53 -19 -3 -1 -3 7 51 09 We can identify 3 intervals which have a change of sign: [-2,-1],[-1,0] and [1,2] If we sketch the graph of the function, i.e. y=f(x), the x values at the point where y=0 are the roots to the equation f(x)=0, since y=f(x). Three roots are confirmed in these intervals i.e. each interval contains one root. The gradient formula can be calculated: f´(x)=3x2-3 f´(5)=72, and after x=5, the gradient formula shows that the gradient just continues to increase with increasing x therefore the curve y=f(x) never crosses the x-axis after x=5. f´(-5)=72, and for any x value lower than x=-5, the gradient formula shows that the gradient just continues

Statistics coursework
Maths statistics coursework Hypothesis: Generally girls have a higher IQ than boys and therefore have a higher total of KS2 (Key Stage 2) results. However, year 7 KS2 results are higher than the year 11's KS2 results. I firstly believe girls have a higher IQ than boys as girls find it easier to concentrate and are more able to work hard over a long period of time. This therefore would affect their KS2 results, as it would mean girls are more able to retain all the information needed in SATs. Although, I think year 7's KS2 results will be higher than year 11's as the tests have become easier over the five years and the teaching has become better too. Plan First of all I will filter my data so that I am only left with data for all the year 11s and all the year 7s. I then will delete all the inappropriate columns of data i.e. favourite subject, leaving me with the following columns: Year Group, Gender, IQ, English, Maths and Science KS2 results Both these steps will remove any data that is unnecessary in my investigation so that I am left with only suitable data making it easier and quicker for me to use the records. Following this I will look through the data for any anomalies such as a child achieving a level 7 in their KS2 SATs as this is not possible with the tests taken. I would also exclude any records with some data not present. If there are any I will delete

The aim of this investigation is to gain statistical information to show authorship of a text.
AS Mathematics: (AQA) Statistics Coursework DESIGN Introduction: The aim of this investigation is to gain statistical information to show authorship of a text. For this investigation, I will use two pieces of text in order to investigate authorship. In order for the investigation to be valid, the two pieces of text I need to use should have a different theme attached to them. By theme, I mean they need to be different in a broad way i.e. different genre, different age readers. I had a number of different texts to compare but I decided to use one adult text and one child text as this will give me a more obvious variation and expectation. For this investigation I will be calculating the mean of the distribution for both populations. I will then be able to calculate the standard deviation and variance, and I will be using the unbiased estimator for both populations. I will calculate the standard error and confidence intervals for both populations. My data will be represented using frequency distribution tables and these can show the trends of a frequency distribution graph. The normal distribution diagrams will also be used for the confidence intervals representation. Population: In a statistical enquiry, you often need information about a particular group. This group is known as the POPULATION and it could be small, large or infinite. The population for my
Design an investigation to see if there is a significant relationship between the number of bladders and the length of longest frond in Fucus species of seaweed at two different locations on a rocky shore
Design an investigation to see if there is a significant relationship between the number of bladders and the length of longest frond in Fucus species of seaweed at two different locations on a rocky shore Introduction: Robin Hood's Bay is situated on the Yorkshire coast of England. It is a well-studied, large rocky shore and consists of shelved rocks which form a series of ledges and gullies. This shelved structure of the shore enables it to be clearly identified as three separate areas; lower, middle and upper shores. The bay is home to a range of organisms, including Fucus vesiculosus, which is also known as 'bladder wrack', due to its structure. Fucus vesiculosus is brown/green algae, easily recognised by its paired bladders occurring on either side of a prominent midrib. The frond is generally not strongly spiralled, and does not have a serrated edge. In optimum conditions, the fronds on this particular seaweed can grow up to 2m in length. Fucus vesiculosus is shown in the picture above. I am going to design and carry out an investigation in order to explore the relationship between the number of bladders and the length of the longest frond on Fucus vesiculosus at low and middle shore. Null Hypotheses: For this investigation I will make two null hypotheses, stated below; . There is no significant relationship between the length of longest frond and number of bladders

To test if my secondary evidence is correct and therefor to find if adult men have a higher pulse rate or adult women and the average pulse rate for both sexes.
(Page 1 of 24) MOHAMMED EMAMY MODUAL 2 UNIT 5 COURSEWORK. AQA PULSE RATES Introduction Not everyone has the same pulse rate, and pulse rate cane be effected by a number of different variables. For my task I will be investigating the difference in MEN and WOMEN'S pulse rates. In order to form my hypotheses I have used secondary data from the Internet, cited at: www.vitalstatistcs.htm. Statistics show that the average male pulse rate is about 72, and the average adult female is between 76 to 80, and the average pulse rate for men and women is between 60 - 80. AIM To test if my secondary evidence is correct and therefor to find if adult men have a higher pulse rate or adult women and the average pulse rate for both sexes. HYPTHESIS On average Adult men will have a pulse rate between 71 - 73, adult women will have a pulse rate of 76 - 80, and the average pulse rate for both sexes will be between 60 - 80. OBJECTIVES .To collect data from a suitable number of individuals using an appropriate sampling method. 2. To present the data in a meaningful way. 3. To interpret data and analyse results and diagrams. 4. To draw conclusions on analysis, state weather the prediction was correct. (Page 2 of 24) METHOD In order to test my hypothesis I will use
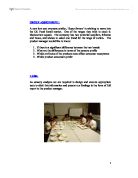
Case study -Super Savers is wishing to move into the UK Food Retail market.
GROUP ASSIGNMENT: A new low cost overseas retailer, 'Super Savers' is wishing to move into the UK Food Retail market. One of the ranges they wish to stock is blackcurrant squash. The company has two potential suppliers, Ribeena and Tesco, and wishes to select one brand for the range of outlets. The product manager would like to know: . If there is a significant difference between the two brands 2. What are the differences in terms of the sensory profile 3. Which attributes of the products most affect consumer acceptance 4. Which product consumers prefer TASK: As sensory analysts we are required to design and execute appropriate tests to elicit this information and present our findings in the form of full report to the product manager. 1.ABSTRACT In this report, a new low cost overseas retailer, 'Super Savers' is wishing to move into the UK Retail Market. One of the ranges they wish to stock is blackcurrant squash. The company has two potential suppliers, Ribeena and Tesco, and wishes to select one brand for the range of outlets. Four tests had been chosen to undertake, which were the Triangle test, the Just-Right test, the Descriptive Analysis test (taste, colour, smell, and texture) and the 9-point hedonic test. For the achievement of the above four tests, twenty panellists were selected. The results obtained from this evaluation showed in general that there