Explore and review the basic physics of how different things relate to one another.
Lab Report 1 Physical Relationships By Ben Sefcik ID#2245154 Physics 200 Athabasca University Introduction This lab is intended to explore and review the basic physics of how different things relate to one another. The lab is broken up into four different parts: rubber band force constant, pendulum, combination of errors, and quadratic functions. The first to be looked at was elasticity compared to weight and gravitational force: rubber band force constant. The relationship should produce a linear relationship and a linear regression was performed to verify that it was linear and to see more closely the relationship of the two components. The next section looked at the relationship between the amount of time required for a pendulum to complete 10 oscillations and the length of string used. It was expected that the length of string used would have an exponential effect to the time used. In other words, as the string gets longer the time required to do 10 full oscillations would become exponentially larger. The third part of the lab looked at taking errors into consideration. There are two different types of errors: random and systematic. These errors can have different impacts on the analysis of the results depending on the regression curve that best fits the data collected. This part of the lab will look at these impacts. The

Collect data and investigate whether it can be model by a exponential function
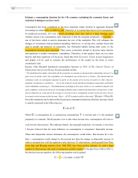
Introduction We were required to analyse a set of data and write a report on it. we had to either find a situation which we had to negotiated with our teacher, that you fell might be able to be a modeled by an exponential function OR given a alternate situation by our teacher. I did the Alternative situation Part A The aim of this assignment was to collect data and investigate whether it can be model by a exponential function ) DATA X (height) Y (time) 2.5 3.45 5 6.12 7.5 9.45 0 13.35 2.5 17.39 5 22.87 7.5 27.97 20 34.45 22.5 44.12 25 64.23 The data that I have collected is from a 1.5 liter coke bottle that has been measured from top to bottom. The height of the bottle was measured to 25cm. I interval that I measured in was 2.5 cm, which gave me 10points for my graph. To get my y points I had to pour water up to the cylindrical section and made a hole at the bottom of the bottle. As the water passes a point I record the time. 2) A mathematical representation of the data Graphically Algebraically The equation for this data is 3.429801*1.126417^x. To get the equation I used the Graphics calculator and find the equation in the data matrix editor. Although when I was trying to validate it the computer gave me a different equation (this is using excel). The equation given was
Find methods of solving equations, which can't be solved algebraically.
Pure 2 Coursework The purpose of this investigation is to find methods of solving equations, which can't be solved algebraically. There are three methods, which can be used to do this: decimal search, Newton-Raphson and rearranging f(x)=0 in the form x=g(x). Then evaluate the usefulness of each method by analysing disadvantages and advantages of each. Finally the best method will be identified. Decimal Search This method uses the fact that as the curve passes through the x-axis there is a change of sign, to identify roots of a chosen function. The fact that there is a change of sign means that the root can be identified to a chosen degree of accuracy in this case four decimal places. This is done by taking increments in x of size 0.1 within an interval containing a root and working out the value of the function for each one. When there is a change of sign this can be repeated between the two value at which it occurs using increments of 0.01 etc. this method is to be used to find the roots for the function x3-3x2+1. The roots, which are to be, identified lie within the intervals [0,1], [-1,0] and [2,3] as shown on the below graph. The root can now be found using the above method as shown below in the tables. [0,1] 0 0.1 0.2 0.3 0.4 0.5 0.6 0.7 0.8 0.971 0.888 0.757 0.584 0.375 0.136 -0.127 -0.408 0.6 0.61 0.62 0.63 0.64 0.65 0.66 0.67 0.68 0.136

Functions Coursework - A2 Maths
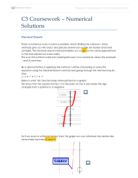
C3 Coursework: Numerical Analysis Change of sign method I want to find the roots of the equation x3-3x-1=0 to five decimal places. Consider the function f(x)=x3-3x-1; hence I want to find the roots of the equation f(x)=0. If the function is continuous in the interval [a,b], where a and b are values x could take, and either: f(a)<0 and f(b)>0 or: f(a)>0 and f(b)<0 then there must be at least one root of the equation f(x)=0 in the interval [a,b]. Therefore we are looking for a change of sign, which will then indicate the interval in which there lies a root of the equation f(x)=0. The table shows values of f(x) at integer values of x from -5 to 5. x -5 -4 -3 -2 -1 0 2 3 4 5 f(x) -111 -53 -19 -3 -1 -3 7 51 09 We can identify 3 intervals which have a change of sign: [-2,-1],[-1,0] and [1,2] If we sketch the graph of the function, i.e. y=f(x), the x values at the point where y=0 are the roots to the equation f(x)=0, since y=f(x). Three roots are confirmed in these intervals i.e. each interval contains one root. The gradient formula can be calculated: f´(x)=3x2-3 f´(5)=72, and after x=5, the gradient formula shows that the gradient just continues to increase with increasing x therefore the curve y=f(x) never crosses the x-axis after x=5. f´(-5)=72, and for any x value lower than x=-5, the gradient formula shows that the gradient just continues
The aim of this coursework is to compare three different numerical methods of solving equations. This will allow us to determine which one is the most efficient, quickest and easiest method to use.
Pure 2 Coursework Solution of equations by numerical methods Introduction The aim of this coursework is to compare three different numerical methods of solving equations. This will allow us to determine which one is the most efficient, quickest and easiest method to use. The three methods I will use are: - Decimal Search method - Newton-Raphson method - Fixed Point Iteration method Software used For all of the three methods I will be using Autograph, which draws accurate graphs, and shows clearly the different roots. I will use it especially for the Newton-Raphson method and Fixed Point Iteration method to find the roots. For the Decimal Search method I will be using Excel, because it makes the various calculations easier and faster. Decimal Search The decimal search is named as it employs the tactic of splitting the current interval of x values into 10 equal intervals of equal size and looking for a change of sign. This process is then repeated, again splitting the current interval into 10 equal intervals of equal size and this can be continued until the root has been found to the required degree of accuracy. The equation that I have chosen to solve is x5 - 2.7x + 1.8 = 0 The graph illustrates y = x5 - 2.7x + 1.8 Zoom of y = x5 - 2.7x + 1.8 between x = -2 and x = 0 We can notice from the graph that y = x5 - 2.7x + 1.8 crosses the x-axis between x = -2

Determine an appropriate parabolic model that fits the data I collected of whirlybird wing length vs. time, doing so by using first principles.
Question 2 -Whirlybird - Nicholas Rypkema 11A Task Statement: In this procedure, I am trying to determine an appropriate parabolic model that fits the data I collected of whirlybird wing length vs. time, doing so by using first principles. Also to find out which wing length would produce longest flight time. Method: Firstly, I made a whirlybird model and timed how long it took to reach the floor from a certain height. This procedure was repeated several times, each time lessening the wing length and keeping the same height. For each wing length, the bird was dropped three times for maximum accuracy. Once this data was collected it was transferred into a graph, and strange points were excluded. After this an appropriate parabolic function was introduced, being as close as possible to the original points. The turning point was the place where the wing length would produce longest flight time. Results: Length (m) Time 1 (s) Time 2 (s) Time 3 (s) Average (s) 6 .38 .12 .25 .25 4 .19 .17 .5 .29 2 .75 .49 .85 .70 0 2.18 2.21 2.41 2.27 8 2.35 2.19 2.44 2.33 6 2.12 2.1 2.09 2.10 4 .62 .68 .66 .65 2 .03 0.91 .02 0.99 0 0.79 0.87 0.7 0.79 Above is my original data. In the graph, it can be seen that there are two significant points that do not fit in a parabolic shape well, and these are the first point and the last point. I decided

The Gradient Fraction
Mathematics Investigation: The Gradient Function My aim in this investigation is to find the different gradients for all curves, including parabolas and straight line curves. The Gradient is the "steepness" of a curve. The gradient is usually founded by a method. To find a gradient of a line, there is a strict method; GRADIENT = VERTICAL DIFFERENCES HORIZONTAL DIFFERENCES In order to use this method you must divide the vertical difference of the point by the horizontal difference of the point. y= mx + c is the general equation for a straight line graph. This equation consists of two parts that you need to remember: "m" is the gradient of the graph "c" is the value where it crosses the y-axis and is called the intercept. In my investigation I will try to use a number of methods .The methods I will be using are methods like, the triangle method, the Increment Method, Tan ? Method, Number of Differences and Differentiation. I will also show examples of Maximum and Minimum curves. I will also explain the concept of a 'limit'. The first method to use is the "triangle method". The triangle method is where you have to draw a gradient line which best fits the "x" value point on the graph. From there you have draw down a line to the "x" value and draw a line across the value where the gradient line finishes. Here is an example: The second step is to find the
Although everyone who gambles at all probably tries to make a quick mental marginal analysis of the game, in depth analysis of the figures shall reveal how a rational player reacts to better odds, or a lower entry price, or a higher potential payout.
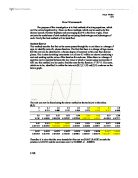
Introduction Although everyone who gambles at all probably tries to make a quick mental marginal analysis of the game, in depth analysis of the figures shall reveal how a rational player reacts to better odds, or a lower entry price, or a higher potential payout. I also think it's important to know at least a little bit about the gambling industry, seeing as it nets $6.3 billion a year in revenue in Canada while net annual revenue from alcohol and tobacco sales in Canada is $5.9 billion. When searching for the relationship between Entry Price (E) into a game, the odds of winning that game (O), and the payout of the game (P), one must look at different games that incorporate these three variables. There are three cases to be examined: Case 1 can be represented by a lottery, where E is set, and both O and P are known and the player tries to match numbers. Case 2 can be represented by a simple game of chance, which is used in The St. Petersberg Paradox, where E is constant, but O is not set, therefore P is infinite. Case 3 can be represented by a draw, where E is set, and both O and P are known. A process of linear regression will be used to determine the actual relationship between P and O for each game. Analysis Case 1 The lottery chosen is from Ontario, lotto 649. The player pays $1 to enter the game, and then chooses 6 non-repeating numbers from 1 to 49. Thus the

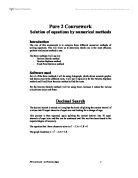
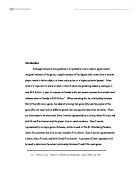
Graph Original of Equation y=3x^5-3x+1
This is a graph of the original equation, in the form x = g (x), I am investigating: 0 = 3x^5 - 3x + 1 Graph of Re-arranged equation: x = 3x^5 + 1 3 The Rearrangement method, firstly, draws a vertical line between the 2 curves. When it reaches the second curve, another line is drawn horizontally. This carries on until a value of the function is calculated to the required accuracy. However, for this method to work, the gradient of the curve, at the starting point, must be between -1 and 1. I am going to investigate the root in the middle. Below is a zoomed-in view of the middle root of the rearranged equation. Here it is clear that there is a repeated answer of 0.33773. Therefore the root is 0.337735 ±0.000005. This could also be done without the use of a computer: Failure Case There are sometimes where this method might not work. Example: Graph of re-arranged equation: x = 3x^5 + 1 3 Here I will try to calculate the value of the function at root 3. Below is a zoomed-in view of root 3. This reading says 'Overflow'. This means that it can not be calculated using this method. As seen and stated in the graph above, the lines drawn are getting further apart. This is also shown in the '?x' column in the table of results, where the answers get larger and

Estimate a consumption function for the UK economy explaining the statistical techniques you have used.
Project: Estimate a consumption function for the UK economy explaining the statistical techniques you have used. Abstract The purpose of doing this project is to estimate different consumption functions and to observe the relationships between consumption and a set of variables, such as household disposable income, house price inflation and inflation. I have extended my data to include the periods 1999 to 2001. I will construct and apply a model to such data and apply an appropriate set of tests to it. This project will be achieved using PC GIVE, which is a computerised statistical package. This will enable me to produce graphical analysis and present results in an appropriate manner. Introduction To address economic problem in context we separate an economy's aggregate expenditure (Y) into four categories: consumption (C), investment (I), government expenditure (G), and net foreign expenditure, or exports less imports (X-M). The aggregate demand identity Y=C + I + G + (X - M) Is used to represent these four elements. It is useful to make this kind of categorization, because different agents are responsible for each type of expenditure and therefore they must have different determinants. (William E.Griffiths, R, Carer Hill, George G. Judge, (1993) Learning and Practicing Econometrics, 1993 by John Wiley & Sons, Inc, page 261) Consumption is the most important