How does the concentration of hydrogen peroxide affect the time (s) it takes the enzyme catalase to decompose it into water and oxygen gas?
Biology Hl-Enzyme Design IA Elena Mastin Wood Research Question: How does the concentration of hydrogen peroxide affect the time (s) it takes the enzyme catalase to decompose it into water and oxygen gas? Variables: Dependent: . Time (in seconds) taken for the decomposition reaction to be complete. . Measured using a stopwatch Independent: . Molar concentration (mol/L) of hydrogen peroxide (H2O2) . Solutions will be increased in concentration from 1 mol/L to 1.25 mol/L, to 1.5 mol/L, to 1.75 mol/L, to 2 mol/L. Controlled: . Mass (in grams) of pureed cow’s liver (catalase) . Each test will use 10 grams of pureed cow’s liver, containing the enzyme catalase. 2. If uncontrolled, the reaction time could be either increased or decreased because of the changed amount of the catalyst, create imprecise data. . Temperature . The lab will be kept at a constant temperature of 20 degrees Celsius. 2. Temperature is a primary factor affecting both enzyme activity and reaction speed. . Volume of hydrogen peroxide . A standard volume of 20mL of hydrogen peroxide will be used in each test, with ample amounts of water to change the concentration. 2. If it was measured using 20mL of the hydrogen peroxide solution, there would be less of the substance at lower concentrations, which would speed the reaction and possibly skew the
Predation and natural selection simulation
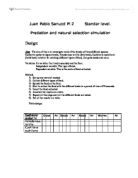
Juan Pablo Sanucci Pl 2 Standar level. Predation and natural selection simulation Design: Aim: The aim of this is to investigate wich of the breaks of three different species: Cucharita cucharita (spoon beak), Tenedoricus toritlla (fork beak), Cuchillaria cuchillaria (knife beak) is better for catching different types of food, like grass seeds and more. Variables: fix variable: the time(in seconds) and the floor. Independent variable: The type of beak. Dependent variable: This is the units of food collected. Method: ) Set up any material needed. 2) Collect different types of food. 3) Spread the food on the floor. 4) Start to collect the food with the different beaks in a period of time of 20 seconds. 5) Count the food collected 6) Annotate the results on a table. 7) Repeat all this steps until all the different foods are tested. 8) Put all the results in a table. Table design: Species of birds Grass Av Seeds Av Roots Av Worms Av Cucharita cucharita Tenedoricus tortilla Cuchillaria cuchillaria Data collection: Results: Species of birds Grass Av Seeds Av Roots Av Worms Av Cucharita cucharita 8 9 7 8 6 5 8 6,3 4 5 5 4,6 46 40 25 37 Tenedoricus tortilla 2 2 3 2,3 8 6 0 8 6 7 6 6,3 38 40 34 37,3 Cuchillaria cuchillaria 7 6 6 6,3 2 3 2 0 0 0,3 36 30 5 27 Graph: Conclusión: We can
Biology practical
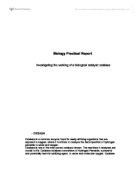
Biology Practical Report Investigating the working of a biological catalyst: catalase - DESIGN Catalase is a common enzyme found in nearly all living organisms that are exposed to oxygen, where it functions to catalyze the decomposition of hydrogen peroxide to water and oxygen. Catalase is one of the most potent catalysts known. The reactions it catalyses are crucial to life. Catalase catalyses conversion of Hydrogen Peroxide, a powerful and potentially harmful oxidizing agent, to water and molecular oxygen. Catalase also uses Hydrogen Peroxide to oxidise toxins including Phenols, Formic Acid, Formaldehyde and Alcohols. In this practical, the reactions occuring in the substances where catalase( in a form of liver) is added, are observed and recorded. The testing requires 8 test tubes ,which of 1 is filled with 4 ml of distilled water and from 2-8 is filled with 4 ml of fresh H202. Every test tube recives an additive,which is placed there after the H202/distilled water; Tube 1: cube of liver Tube 2: small amount of manganese dioxide Tube 3: cube of liver Tube 4: 1/2 ml of ground liver Tube 5: cube of boiled liver Tube 6: cube from acidic condition( pre-prepared in a solution) Tube 7: cube of liver from alkaline condition(pre-prepared in a solution) Tube 8: 1/2 ml of ground liver,also temperature of H2O2 was measured before and after the addition of liver.

MICROMETRY- Calculating actual width of cell wall:
LE BOCAGE INTERNATIONAL SCHOOL MICROMETRY Practical 1 Mahmood Zabioullah Fokeerbux 3/24/2009 Question 1: Electron micrograph 1 RAW DATA COLLECTED Magnification= X16, 000 Record Magnified width of the cell wall (±1mm) 3mm 2 3mm 3 4mm 4 4mm 5 3mm PROCESSING DATA Mean of records= (3mm+3mm+4mm+4mm+3mm)/5 =17mm/5 =3.4mm ˜3mm Standard Deviation=0.55 Range=4mm-3mm =1mm Calculating actual width of cell wall: Magnification= size of drawing/ size of object Magnification= X16, 000 Average width of magnified cell wall= 3mm Actual width of cell = size of object/ magnification =3mm/16, 000 =0.0001875mm =0.1875µm =187.5nm ˜188nm EVALUATION The standard deviation is very low showing that the values recorded are very close to the mean (clustered to the mean). The range is not big, thus showing no outliers are found. Therefore the data collected can be said to be reliable. The value obtained could have been more accurate if more recordings were taken. Question 2: Electron micrograph 2 ) Diameter of the nucleolus RAW DATA COLLECTED Magnification= X25, 000 Record Magnified diameter of nucleolus (±1mm) 76mm 2 77mm 3 77mm 4 77mm 5 76mm PROCESSING DATA Mean of records= (76mm+77m+77mm+77mm+76mm)/5 =383mm/5 =76.6mm ˜77mm Standard Deviation=0.55 Range=77mm-76mm =1mm Calculating actual width of cell wall: Magnification= size of
Investigating enzymes
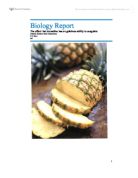
Biology Report The effect that bromeline has on gelatines ability to coagulate Yasmin Kazemi Ahari Rasmussen 2.U Journal Investigating enzymes Aim: The aim of the experiment was to investigate the effect of the enzyme bromeline on gelatins ability to form a mass, and how temperature also can have an affect on this particular process. Hypothesis: It is expected that when the bromeline enzyme isn't present, that the gelatin will remain staying as gel, when dissolved in water. The untreated raw juice, would be the only result where the process would make it break down the proteins in the gelatin. Materials: Scissors, Beaker, Canned Pineapple, Raw pineapple, Pipettes, Labels, Tubes in holder, Buntson burners, Gelatin Method: . Two pieces of gelatin were cut into smaller pieces and thereafter heated in approximately 100 ml of water in a beaker using a Buntson burner. The process was done carefully, and with caution. 2. When all the gelatin was dissolved, the heat was turned off and the solution got time to cool down, approximately 5-10 minutes. 3. While waiting for the solution to get cooled down, the pineapple juice is made by cutting a fresh pineapple and blending the pineapple to result in having fresh pineapple juice. 4. When 5 ml of fresh juice was made, 2,5 ml was removed from the mix and boiled in a test tube for a few seconds. 5. The gelatin

The consequences of introducing alien species into a ecosystem
The Consequences of Introducing Alien Species The introduction of non-native species to an ecosystem is one of the major causes of decreased biodiversity. Termed alien species, they are also known as exotic, introduced, non-indigenous, or invasive species. As the names imply, these species do not belong to ecosystems in which they are either intentionally or unintentionally placed. They tend to disrupt the ecosystem's balance by multiplying rapidly. These species are often plants, fishes, mollusks, crustaceans, algae, bacteria or viruses. Many alien species are transferred into marine ecosystems through the ballast water transported during commercial shipping operations. Alien species are often introduced into freshwater ecosystems such as estuaries, rivers, lakes and streams by humans discarding animals or plants formerly held in captivity. In some cases, species used as bait can invade freshwater ecosystems. Well-known invasive species include the Northern Snakehead fish, the Zebra mussel, the Sea Lamprey and the Asiatic Clam, Corbicula fluminea. Zebra mussels (Dreissena polymorpha) are fingernail-sized, fresh water mussels native to the Caspian Sea/Black Sea region of Asia. They are believed to have been transported to the Great Lakes via ballast water from a trans-oceanic vessel. The ballast water, taken on in a fresh water European port was subsequently discharged

Finding the vitamin C content of a lemon
________________ INTRODUCTION In our experiment we tested the amount of vitamin C in a certain amount of lemon juice. We did this with the help of PCPIP which is an indicator that shows the presence if C vitamin. For this we used the mentioned indicator, pipette, three eprouvetes, 0.1% of C vitamin solution and lemon juice. First we had to get the volume of 0.1% vitamin C solution that is needed for our amount of PCPIP (2ml) to decolorize. Then we had to determine the volume of lemon juice that is needed to decolorize the same amount PCPIP. This provided us with the concentration of vitamin C in the lemon juice. RESULTS We got separated into four groups and the results of all of the groups were in the end combined and the average was calculated. Our first result was that the indicator will change the color if we add 0.75 ml of 0.1 % C vitamin solution to it. We know that 100 ml of the solution contains 0.1 g of vitamin C so with that fact we calculated the amount of grams that can be found in 0.75 ml. We calculated this in the following way: This means that we have 0.75 mg of vitamin C in 0.75 ml of solution. It also means that the indicator (2ml) will turn transparent after we add 0.75 mg of vitamin C. After that we added lemon juice to the third flask with the indicator. We continued with the addition until the indicator turned transparent. It first turned
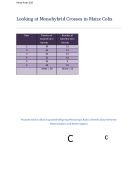
Monohybrid Crosses in Maize Cobs
Henry Poon 12D Looking at Monohybrid Crosses in Maize Cobs ________________ Row Number of Colored Corn Kernels ± 1 Number of Colorless Corn Kernels ± 1 1 30 13 2 29 13 3 26 12 4 32 10 5 35 6 6 28 15 Mean = 30 Mean = 12 Punnett Grid to Show Expected Offspring Phenotypic Ratio of Seed Colour between Heterozygous and Heterozygous C c C CC Cc c Cc cc Parental Genotypes = Cc Cc Parental Phenotypes = Coloured Fruits x Coloured Fruits Phenotypic Ratio =1 Colourless Fruit: 3 Coloured Fruits Genotypic Ratio = 1 Homozygous Dominant: 2 Heterozygous: 1 Homozygous Recessive Comparison between Theoretical Result and Expected Result According to my results, the ratio of colorless kernels to colored kernels is 1:2.5 or in other words for every 2 colourless kernels, there are 5 coloured kernels. However the expected phenotypic ratio is 1 colourless corn kernel: 3 coloured corn kernels. The ratio obtained from my results and the expected ratio do not closely match because as the number of colorless corn kernels increases in both ratios, the difference between the number of colored corn kernels gets bigger and bigger. So for example if the number of colourless corn kernels was 50, the number of coloured corn kernels would be 125 and 150, and if the number of colourless corn kernels was 100, the number of coloured corn kernels would be 250 and 300.
Biology Soil Sampling
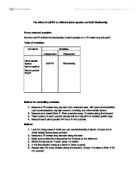
The effect of soil PH on different plant species and their biodiversity Focus research question: How the soil PH affects the biodiversity of plant species on a 70 meter long transect? Table of Variables: Constants Variables Independent Dependent Other abiotic factors Soil PH Biodiversity Same daytime Same quadrat lenght Method for controlling variables: . Measure a 70 meters long transect at an extended area, with same characteristics such as temperature, day light amount, humidity, and other abiotic factors. 2. Measure and create 50cm X 50cm quadrats every 10 meters along the transect. 3. Take 4 grams of each quadrat sample soil and deposit it on labeled plastic bags. 4. Measure each plant species PH found in the quadrats. Method: . Look for a large area in which you can see biodiversity of plants, choose one in which abiotic factors keep constant. 2. Measure a 70 meters long transect along the area. 3. Make sure to take this measurement at 2'oclock on the afternoon 4. Divide the transect in 7 parts, every 10 meters. 5. In the first division measure a 50cm X 50cm quadrat. 6. Repeat step 5 in every division along the transect. ( Every 10 meters a 50cm X 50 cm quadrat) 7. From each quadrat, take a 4 grams sample of soil and deposit it on labeled plastic bags. (Ex: 10 meters sample, 20 meters sample, 30...). 8. Use a PH meter to measure each quadrats

Breaking Force of Hair Lab
The Breaking Force of Hair Data Processing and Presentation Table #1: Mean and Standard Deviation of Blow Dried Hair and Non-Blow Dried Hair Data Type of Hair Mean (N ± 0.01 N) Standard Deviation (N) Non-Blow Dried Hair Force 2.08 ± 0.68 Blow Dried Hair Force .70 ± 0.83 Note: Microsoft Excel 2007 was used to calculate mean and standard deviation. Note: Error Bars represent standard deviation. Units and uncertainties are not applicable for the independent variable (type of hair). Degrees of Freedom Sum of Samples of Each of the Two Groups - 2 = 50 + 50 - 2 = 98 An approximate value of 100 was used as the degrees of freedom for use in the t-table. Probability due to chance Given the t value for the non-blow dried hair compared to the blow dried hair is 1.97, the t-table can be used to find the probability that the difference between the two groups is due to chance. The t value of 1.99 was used an approximate t value, since a 1.97 value in the 100 degrees of freedom rows does not exist. Therefore, the probability that the difference between the two groups is due to chance is 0.05 (5%). Range Non-Blow Dried Hair Force Blow Dried Hair Force Range = Largest value - Smallest Value = 3.47 - 0.85 = 2.62 Range = Largest value - Smallest Value = 3.88 - 0.03 = 2.85 Conclusion The average hair breaking force of non-blow dried hair is 2.08 N ± 0.01 N, with


